# EGRET 
[](https://cran.r-project.org/package=EGRET)
[](https://cran.r-project.org/package=EGRET)
[](https://cran.r-project.org/package=EGRET)
Exploration and Graphics for RivEr Trends (`EGRET`): An R-package for
the analysis of long-term changes in water quality and streamflow,
including the water-quality method Weighted Regressions on Time,
Discharge, and Season (WRTDS).
Look for new and improved documentation here:
The link for the official USGS publication user guide is here:
A companion package [`EGRETci`](https://doi-usgs.github.io/EGRETci/)
implements a set of approaches to the analysis of uncertainty associated
with WRTDS trend analysis.
If you are familiar with the traditional `EGRET` workflow, check out the
\[Overview and
Updates\]( to
see how all the latest updates relate.
Recent introduction to WRTDS and the `EGRET` package at the 12th
National Monitoring Conference April 19, 2021:
[New capabilities](https://www.youtube.com/watch?v=ThxdHxrw5qk)
## Package Installation
To install the EGRET package, you must be using R 3.0 or greater and run
the following command:
``` r
install.packages("EGRET")
```
## Background:
Evaluating long-term changes in river conditions (water quality and
discharge) is an important use of hydrologic data. To carry out such
evaluations, the hydrologist needs tools to facilitate several key steps
in the process: acquiring the data records from a variety of sources,
structuring it in ways that facilitate the analysis, routines that will
process the data to extract information about changes that may be
happening, and graphical techniques that can display findings about
change. The R package `EGRET` (Exploration and Graphics for RivEr
Trends) was developed for carrying out each of these steps in an
integrated manner. It is designed to accept easily data from three
sources: U.S. Geological Survey hydrologic data, Water Quality Portal
Data (currently including U.S. Environmental Protection Agency (EPA)
STORET data, and USDA STEWARDS data), and user-supplied flat files. The
`EGRET` package has components oriented towards the description of
long-term changes in streamflow statistics (high flow, average flow, and
low flow) as well as changes in water quality. For the water-quality
analysis, it uses Weighted Regressions on Time, Discharge and Season
(WRTDS) to describe long-term trends in both concentration and flux.
`EGRET` also creates a wide range of graphical presentations of the
water-quality data and of the WRTDS results. The following report serves
as a user guide, providing detailed guidance on installation and use of
the software, documentation of the analysis methods used, as well as
guidance on some of the kinds of questions and approaches that the
software can facilitate.
`EGRET` includes statistics and graphics for streamflow history, water
quality trends, and the statistical modeling algorithm Weighted
Regressions on Time, Discharge, and Season (WRTDS). Please see the
official EGRET User Guide for more information on the `EGRET` package:
The best ways to learn about the WRTDS
approach is to read the User Guide and two journal articles. These
articles are available, for free, from the journals in which they were
published. The first relates to nitrate and total phosphorus data for 9
rivers draining to Chesapeake Bay. The URL is:
.
The second is an application to nitrate data for 8 monitoring sites on
the Mississippi River or its major tributaries. The URL is:
For a thorough discussion of the generalized flow normalization method
implemented in the EGRET enhancements, see the paper: “Tracking changes
in nutrient delivery to western Lake Erie: Approaches to compensate for
variability and trends in streamflow”
().
## Sample Workflow
WRTDS on the Choptank River at Greensboro MD, for Nitrate:
``` r
library(EGRET)
############################
# Gather discharge data:
siteID <- "01491000" #Choptank River at Greensboro, MD
startDate <- "" #Gets earliest date
endDate <- "2011-09-30"
# Gather sample data:
parameter_cd<-"00631" #5 digit USGS code
Sample <- readNWISSample(siteID,parameter_cd,startDate,endDate)
#Gets earliest date from Sample record:
#This is just one of many ways to assure the Daily record
#spans the Sample record
startDate <- min(as.character(Sample$Date))
# Gather discharge data:
Daily <- readNWISDaily(siteID,"00060",startDate,endDate)
# Gather site and parameter information:
# Here user must input some values for
# the default (interactive=TRUE)
INFO<- readNWISInfo(siteID,parameter_cd)
INFO$shortName <- "Choptank River at Greensboro, MD"
# Merge discharge with sample data:
eList <- mergeReport(INFO, Daily, Sample)
```
``` r
library(EGRET)
# Sample data included in package:
eList <- Choptank_eList
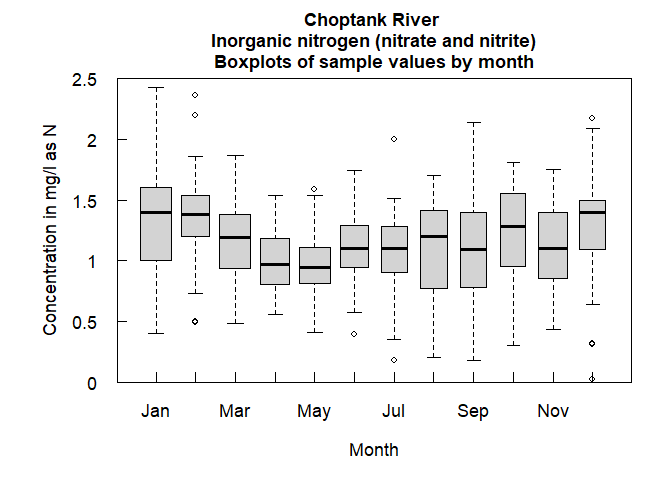
boxConcMonth(eList)
```
``` r
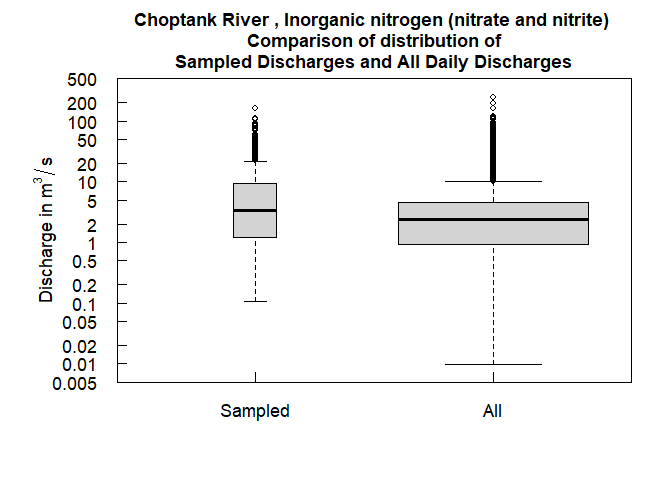
boxQTwice(eList)
```
``` r
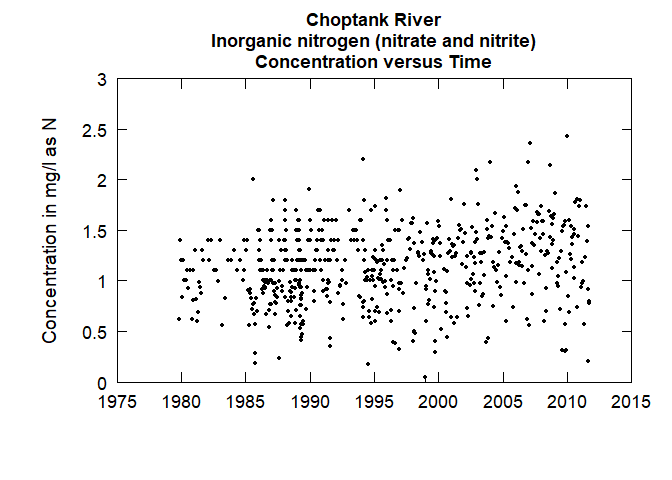
plotConcTime(eList)
```
``` r
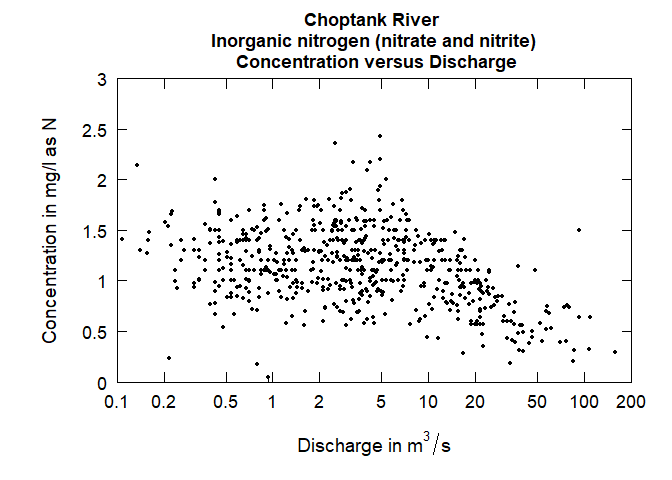
plotConcQ(eList)
```
``` r
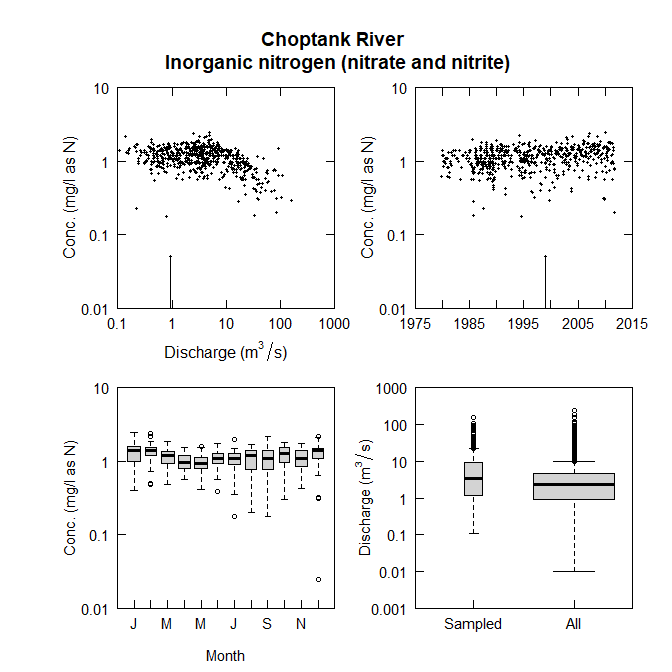
multiPlotDataOverview(eList)
```
``` r
# Run WRTDS model:
eList <- modelEstimation(eList)
#>
#> first step running estCrossVal may take about 1 minute
#> estCrossVal % complete:
#> 0 1 2 3 4 5 6 7 8 9 10
#> 11 12 13 14 15 16 17 18 19 20
#> 21 22 23 24 25 26 27 28 29 30
#> 31 32 33 34 35 36 37 38 39 40
#> 41 42 43 44 45 46 47 48 49 50
#> 51 52 53 54 55 56 57 58 59 60
#> 61 62 63 64 65 66 67 68 69 70
#> 71 72 73 74 75 76 77 78 79 80
#> 81 82 83 84 85 86 87 88 89 90
#> 91 92 93 94 95 96 97 98 99
#> Next step running estSurfaces with survival regression:
#> Survival regression (% complete):
#> 0 1 2 3 4 5 6 7 8 9 10
#> 11 12 13 14 15 16 17 18 19 20
#> 21 22 23 24 25 26 27 28 29 30
#> 31 32 33 34 35 36 37 38 39 40
#> 41 42 43 44 45 46 47 48 49 50
#> 51 52 53 54 55 56 57 58 59 60
#> 61 62 63 64 65 66 67 68 69 70
#> 71 72 73 74 75 76 77 78 79 80
#> 81 82 83 84 85 86 87 88 89 90
#> 91 92 93 94 95 96 97 98 99
#> Survival regression: Done
#eList:
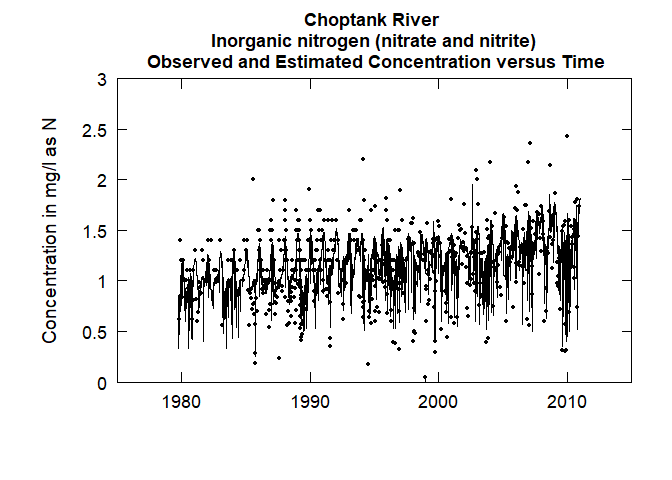
plotConcTimeDaily(eList)
#> plotGenConc = TRUE requires running WRTDSKalman
#> on eList. Switching to WRTDS concentration.
```
``` r
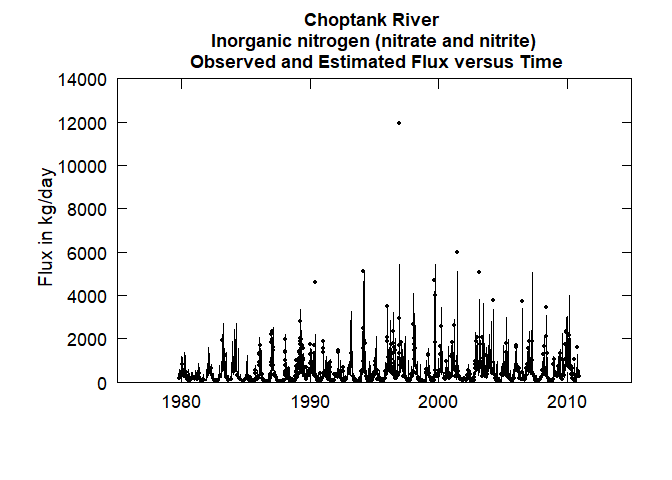
plotFluxTimeDaily(eList)
#> plotGenFlux = TRUE requires running WRTDSKalman
#> on eList. Switching to WRTDS concentration.
```
``` r
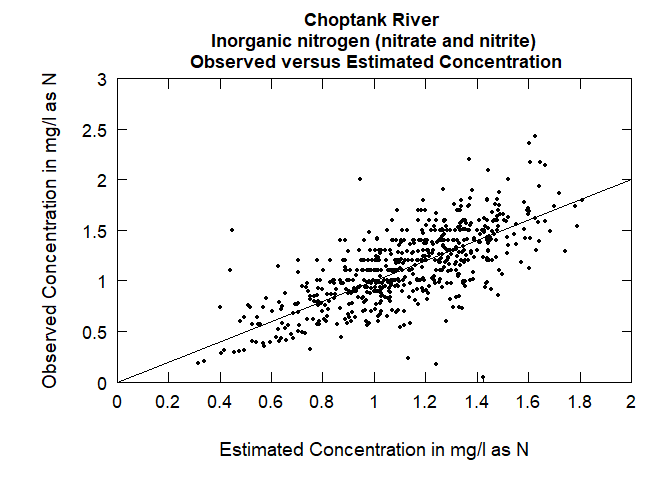
plotConcPred(eList)
```
``` r
plotFluxPred(eList)
```
``` r
plotResidPred(eList)
```
``` r
plotResidQ(eList)
```
``` r
plotResidTime(eList)
```
``` r
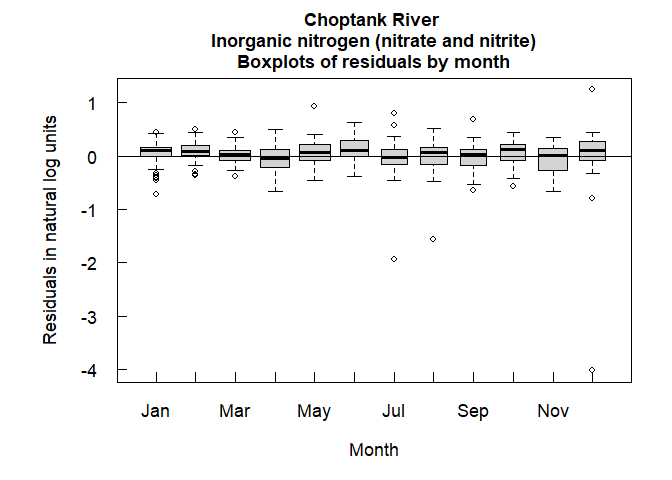
boxResidMonth(eList)
```
``` r
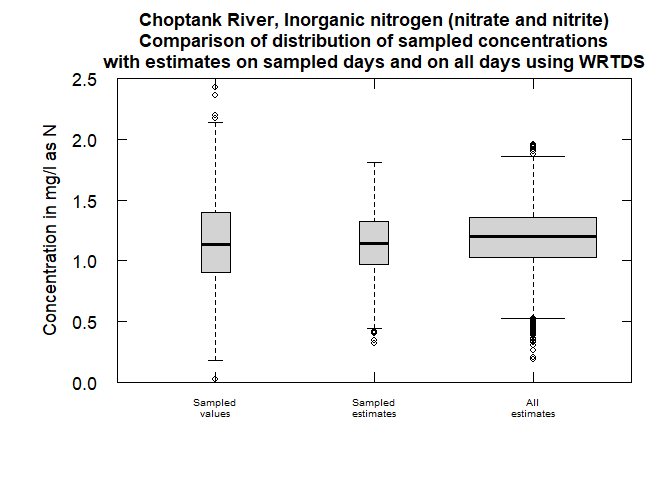
boxConcThree(eList)
```
``` r
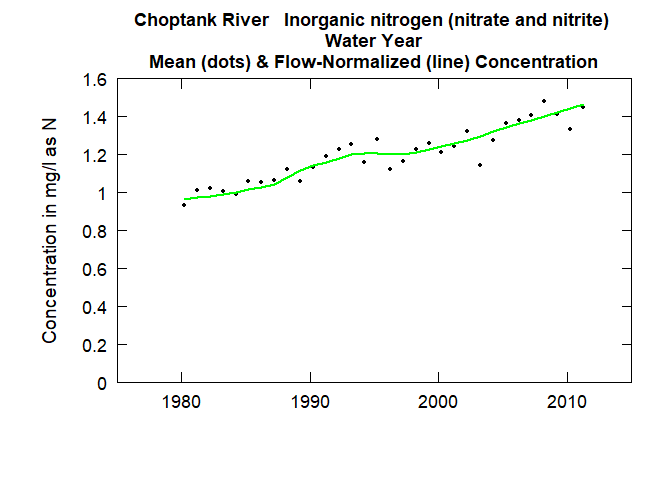
plotConcHist(eList)
```
``` r
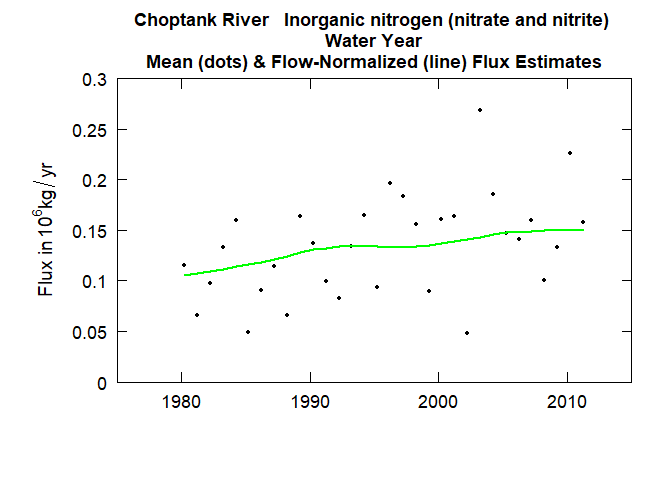
plotFluxHist(eList)
```
``` r
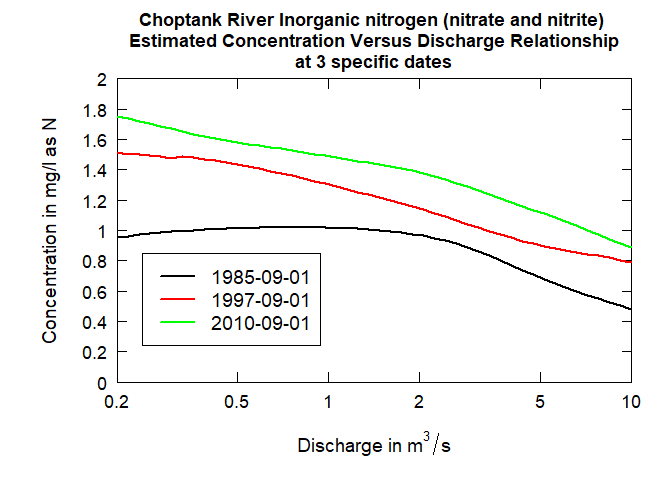
# Multi-line plots:
date1 <- "1985-09-01"
date2 <- "1997-09-01"
date3 <- "2010-09-01"
qBottom<-0.2
qTop<-10
plotConcQSmooth(eList, date1, date2, date3, qBottom, qTop,
concMax=2,legendTop = 0.85)
```
``` r
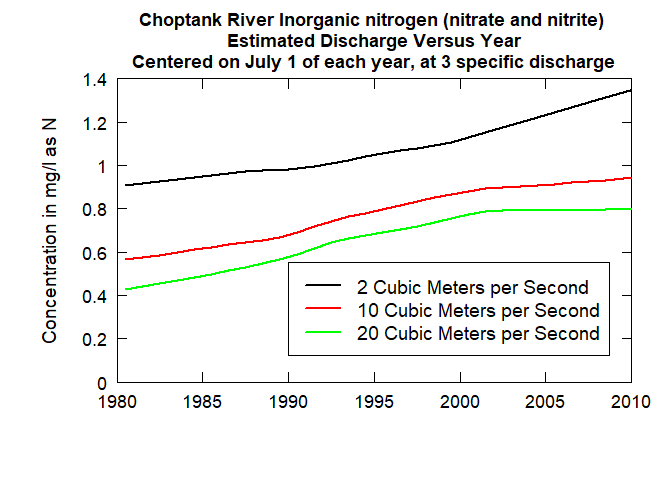
q1 <- 2
q2 <- 10
q3 <- 20
centerDate <- "07-01"
yearEnd <- 1980
yearStart <- 2010
plotConcTimeSmooth(eList, q1, q2, q3, centerDate, yearStart, yearEnd, legendTop = 0.55, legendLeft = 1990)
```
``` r
# Multi-plots:
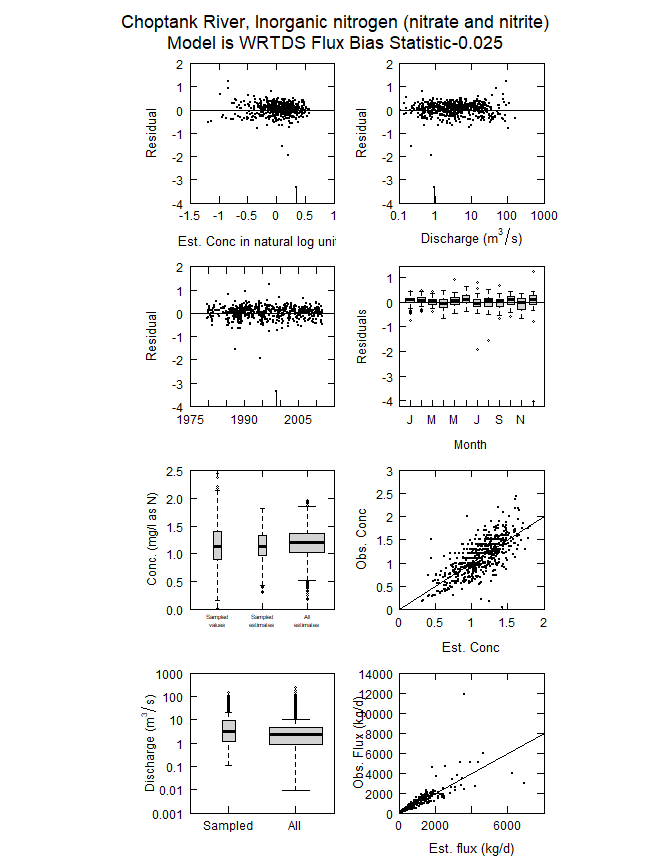
fluxBiasMulti(eList)
```
``` r
#Contour plots:
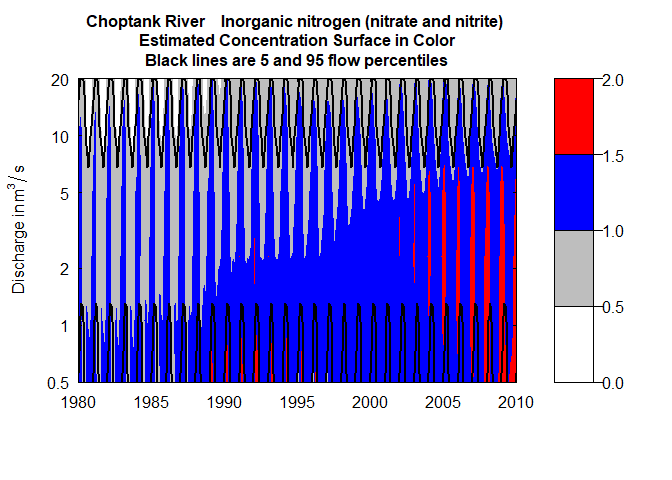
clevel<-seq(0,2,0.5)
yearStart <- 1980
yearEnd <- 2010
plotContours(eList, yearStart,yearEnd,qBottom=0.5,
qTop = 20, contourLevels = clevel)
```
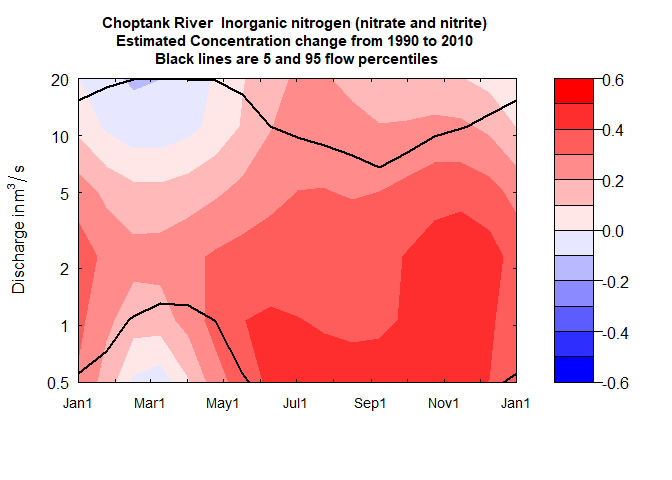
``` r
plotDiffContours(eList, year0 = 1990,
year1 = 2010,
qBottom = 0.5,
qTop = 20,
maxDiff = 0.6)
```
### Sample workflow for a flowHistory application for the entire record
``` r
library(EGRET)
# Flow history analysis
# Gather discharge data:
siteID <- "01491000" #Choptank River at Greensboro, MD
startDate <- "" # Get earliest date
endDate <- "" # Get latest date
Daily <- readNWISDaily(siteID, "00060", startDate, endDate)
#> GET: https://waterservices.usgs.gov/nwis/dv/?site=01491000&format=rdb%2C1.0&ParameterCd=00060&StatCd=00003&startDT=1851-01-01
#> There are 28235 data points, and 28235 days.
# Gather site and parameter information:
# Here user must input some values for
# the default (interactive=TRUE)
INFO <- readNWISInfo(siteID, "00060")
#> GET: https://waterservices.usgs.gov/nwis/site/?siteOutput=Expanded&format=rdb&site=01491000
#> Your site for streamflow data is:
#> 01491000 .
#> Your site name is CHOPTANK RIVER NEAR GREENSBORO, MD
#> but you can modify this to a short name in a style you prefer.
#> This name will be used to label graphs and tables.
#> If you want the program to use the name given above, just do a carriage return,
#> otherwise enter the preferred short name(no quotes):
#>
#> The latitude and longitude of the site are: 38.99719 , -75.78581 (degrees north and west).
#>
#> The drainage area at this site is 113 square miles
#> which is being stored as 292.6687 square kilometers.
#>
#> It is helpful to set up a station abbreviation when doing multi-site studies,
#> enter a unique id (three or four characters should work). It is case sensitive.
#> Even if you don't feel you need an abbreviation for your site you need to enter something(no quotes):
#>
#> Your water quality data are for parameter number:
#> 00060
#> which has the name:' Discharge, cubic feet per second '.
#> Typically you will want a shorter name to be used in graphs and tables.
#> The suggested short name is:' Stream flow, mean. daily '.
#> If you would like to change the short name, enter it here,
#> otherwise just hit enter (no quotes):
#> The units for the water quality data are: ft3/s .
#> It is helpful to set up a constiuent abbreviation, enter a unique id
#> three or four characters should work something like tn or tp or NO3).
#> Even if you don't feel you need an abbreviation you need to enter something (no quotes):
#>
#> Required concentration units are mg/l.
#> The INFO dataframe indicates: ft3/s
#> Flux calculations will be wrong if units are not consistent.
INFO$shortName <- "Choptank River at Greensboro, MD"
eList <- as.egret(INFO, Daily, NA, NA)
# Check flow history data:
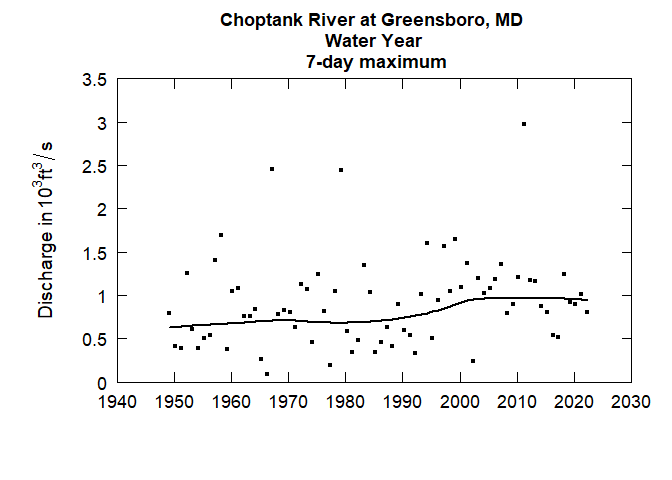
plotFlowSingle(eList, istat = 7,qUnit = "thousandCfs")
```
``` r
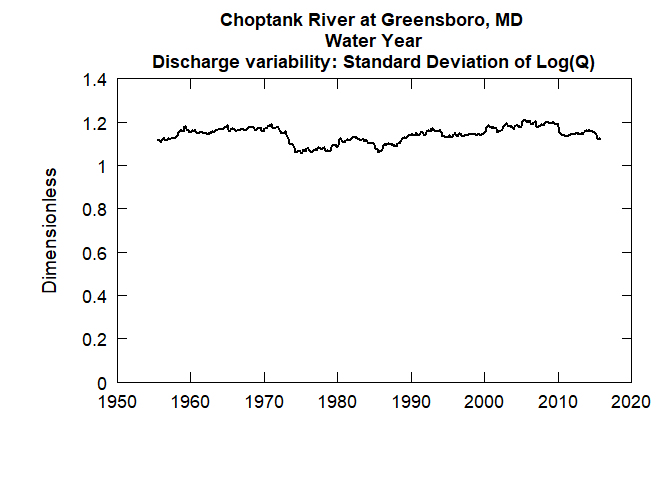
plotSDLogQ(eList)
```
``` r
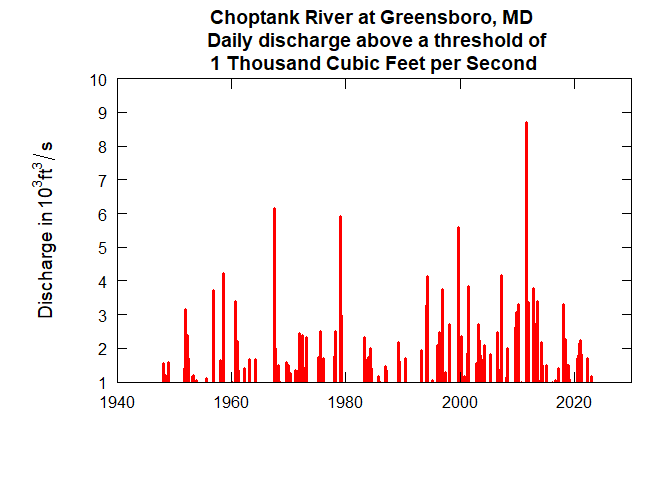
plotQTimeDaily(eList, qLower = 1, qUnit = 3)
```
``` r
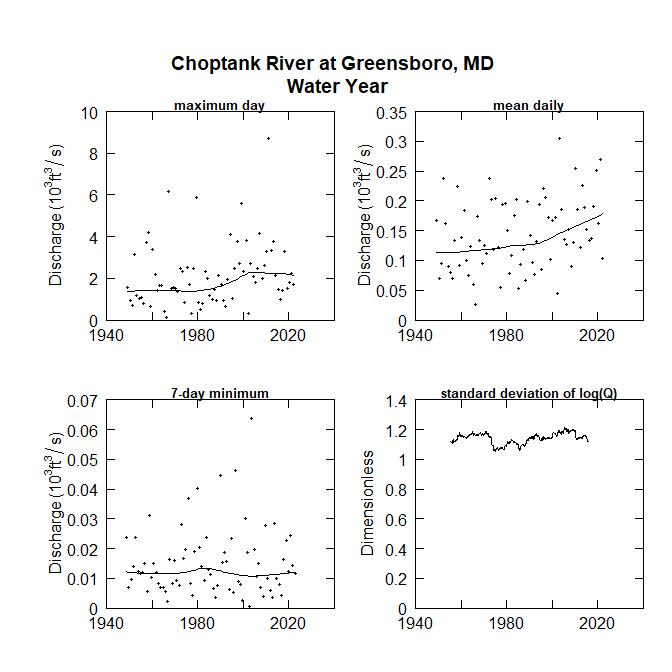
plotFour(eList, qUnit=3)
```
``` r
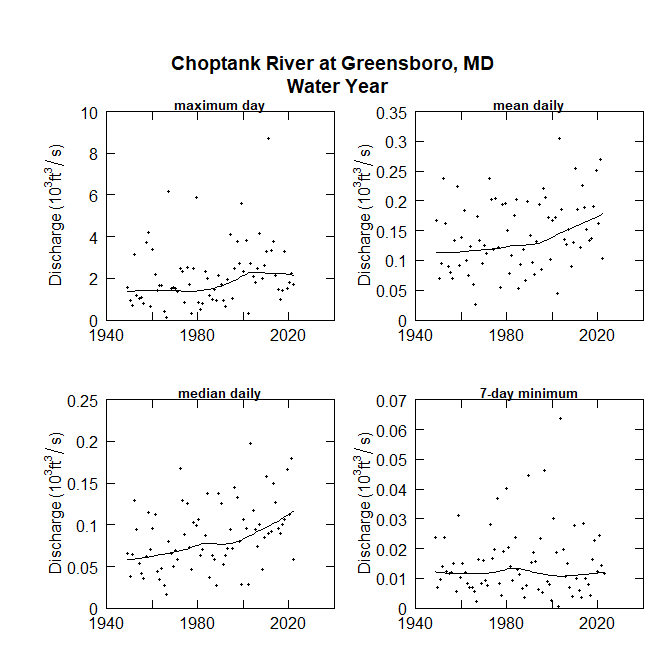
plotFourStats(eList, qUnit=3)
```
## Reporting bugs
Please consider reporting bugs and asking questions on the Issues page:
## Subscribe
Please email questions, comments, and feedback to:
Additionally, to subscribe to an email list concerning updates to these
R packages, please send a request to .
## Package Support
The Water Mission Area of the USGS has supported the development and
maintenance of the `EGRET` R-package. Further maintenance is expected to
be stable through October 2025. Resources are available primarily for
maintenance and responding to user questions. Priorities on the
development of new features are determined by the `EGRET` development
team.
## Sunset date
Funding for `EGRET` currently expires fall 2025. Expectations are that
maintenance and customer service will continue to be supported past that
date.
## How to cite EGRET:
``` r
citation(package = "EGRET")
#> To cite EGRET in publications, please use:
#>
#> Hirsch, R.M., De Cicco, L.A., Murphy, J., 2025, Exploration and
#> Graphics for RivEr Trends (EGRET), version 3.0.11,
#> doi:10.5066/P9CC9JEX
#>
#> A BibTeX entry for LaTeX users is
#>
#> @Manual{,
#> author = {Robert Hirsch and Laura DeCicco and Jennifer Murphy},
#> title = {Exploration and Graphics for RivEr Trends (EGRET)},
#> publisher = {U.S. Geological Survey},
#> year = {2025},
#> url = {https://pubs.usgs.gov/tm/04/a10/},
#> }
```
## References
See this list for WRTDS applications in print:
# Disclaimer
This software is preliminary or provisional and is subject to revision.
It is being provided to meet the need for timely best science. The
software has not received final approval by the U.S. Geological Survey
(USGS). No warranty, expressed or implied, is made by the USGS or the
U.S. Government as to the functionality of the software and related
material nor shall the fact of release constitute any such warranty. The
software is provided on the condition that neither the USGS nor the U.S.
Government shall be held liable for any damages resulting from the
authorized or unauthorized use of the software.
# Package index
## Import Data
Functions for user-generated or web retrieval data.
- [`readUserDaily()`](readUserDaily.md) : Import user daily data for
EGRET analysis
- [`readUserSample()`](readUserSample.md) : Import user-supplied sample
data for EGRET analysis
- [`readNWISDaily()`](readNWISDaily.md) : Import NWIS Daily Data for
EGRET analysis
- [`readNWISSample()`](readNWISSample.md) : Import USGS Sample Data for
EGRET analysis
- [`readWQPSample()`](readWQPSample.md) : Import Sample Data from the
Water Quality Portal for WRTDS
- [`readNWISInfo()`](INFOdataframe.md)
[`readWQPInfo()`](INFOdataframe.md)
[`readUserInfo()`](INFOdataframe.md) : Import metadata to create INFO
data frame
## WRTDS
Functions working running and analyzing the WRTDS model
- [`modelEstimation()`](modelEstimation.md) : Estimation process for the
WRTDS (Weighted Regressions on Time, Discharge, and Season)
- [`setUpEstimation()`](setUpEstimation.md) : setUpEstimation
- [`WRTDSKalman()`](wrtdsK.md) : WRTDS-Kalman
- [`runPairs()`](runPairs.md) : Runs a comparison of any two years in
the record.
- [`runGroups()`](runGroups.md) : Runs a comparison of any group of
years in the record.
- [`runSeries()`](runSeries.md) : Annual series of flow-normalized
concentration and flow-normalized flux
- [`runSurvReg()`](runSurvReg.md) [`run_WRTDS()`](runSurvReg.md) : Run
the weighted survival regression for a set of estimation points
(defined by DecYear and Log(Q))
- [`estCrossVal()`](estCrossVal.md) : Jack-Knife cross validation of the
WRTDS (Weighted Regressions on Time, Discharge, and Season)
- [`estDailyFromSurfaces()`](estDailyFromSurfaces.md)
[`getConcFluxFromSurface()`](estDailyFromSurfaces.md)
[`getSurfaceEstimates()`](estDailyFromSurfaces.md)
[`bin_Qs()`](estDailyFromSurfaces.md) : Estimates all daily values of
Concentration, Flux, Flow-Normalized Concentration, and Flow
Normalized Flux
- [`estSurfaces()`](estSurfaces.md) : Estimate the three surfaces (for
yHat, SE and ConcHat) as a function of DecYear and logQ and store in
the three-dimensional object called surfaces
- [`flexFN()`](flexFN.md) : Flexible Flow Normalization
## Plot Data
Functions for plotting eList objects
- [`multiPlotDataOverview()`](multiPlotDataOverview.md) : Produces a 4
panel plot that gives an overview of the data set prior to any
processing
- [`plotFlowSingle()`](plotFlowSingle.md) : Creates a plot of a time
series of a particular flow statistic and a loess smooth of that flow
statistic
- [`plotFluxQ()`](plotFluxQ.md) : Sample data plot: observed log flux vs
log discharge
- [`plotFour()`](plotFour.md) : Makes four graphs of streamflow
statistics on a single page
- [`plotFourStats()`](plotFourStats.md) : Makes four graphs of annual
streamflow statistics on a single page
- [`plotQTimeDaily()`](plotQTimeDaily.md) : Plot of the discharge time
series
- [`plotSDLogQ()`](plotSDLogQ.md) : Graph of the standard deviation of
the log of daily discharge versus year
- [`boxConcMonth()`](boxConcMonth.md) : Box plot of the water quality
data by month
- [`boxQTwice()`](boxQTwice.md) : Two box plots side-by-side, discharge
on sample days, and discharge on all days
- [`plotConcTime()`](plotConcTime.md) : Plot of Observed Concentration
versus Time
- [`plotConcQ()`](plotConcQ.md) : Plot of Observed Concentration versus
Discharge
- [`boxConcThree()`](boxConcThree.md) : Three box plots side-by-side
- [`plot15()`](plot15.md) : Makes 15 graphs of streamflow statistics on
a single page. These encompass the 7-day minimum, mean, and 1-day
maximum for each of the following 5 Periods of Analysis: Annual, Fall,
Winter, Spring and Summer.
- [`plot1of15()`](plot1of15.md) : plots 1 of the 15 graphs of streamflow
statistics on a single page
## Plot Model Outputs
Functions for plotting modeled eList objects
- [`plotConcPred()`](plotConcPred.md) : Plot of Observed Concentration
versus Estimated Concentration
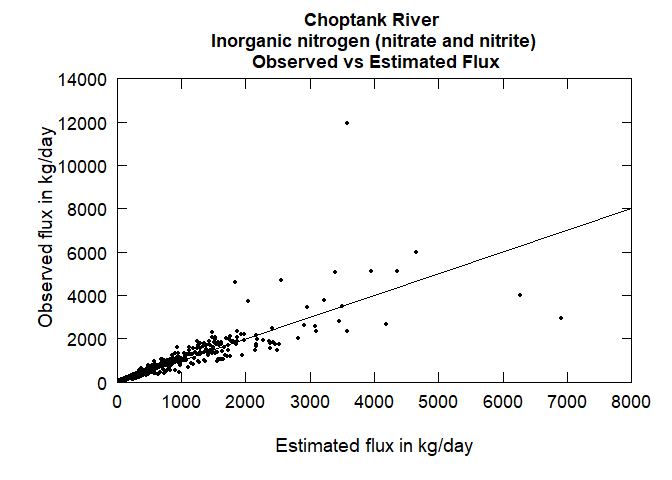
- [`plotFluxPred()`](plotFluxPred.md) : Graph of observed versus
estimated flux
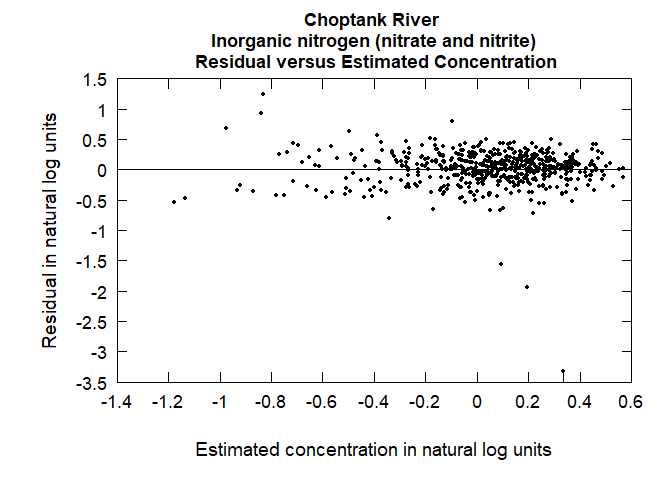
- [`plotResidPred()`](plotResidPred.md) : Plot of the residuals from
WRTDS versus the estimated values (all in log concentration units)
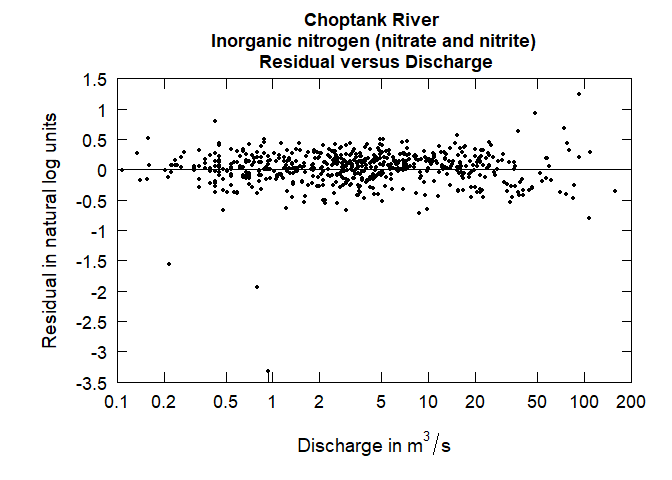
- [`plotResidQ()`](plotResidQ.md) : Plot of the residuals from WRTDS (in
log concentration units) versus the discharge
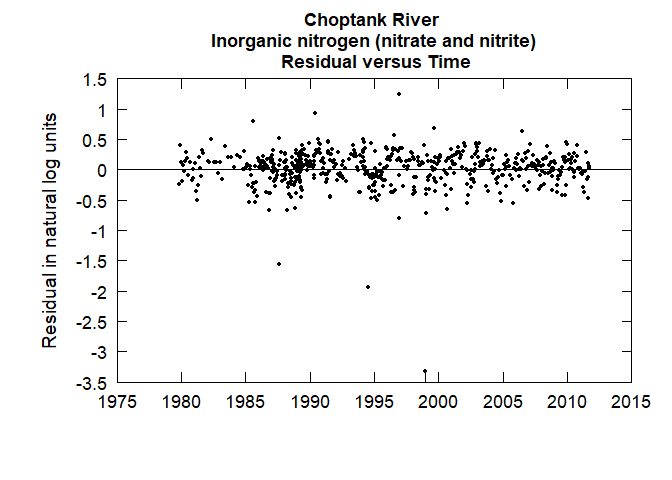
- [`plotResidTime()`](plotResidTime.md) : Plot of the residuals from
WRTDS (in log concentration units) versus time
- [`boxResidMonth()`](boxResidMonth.md) : A box plot of WRTDS residuals
by month
- [`plotConcHist()`](plotConcHist.md) : Graph of annual concentration
and flow normalized concentration versus year
- [`plotFluxHist()`](plotFluxHist.md) : Graph of annual flux and flow
normalized flux versus year
- [`plotFluxTimeDaily()`](plotFluxTimeDaily.md) : Plot of the time
series of daily flux estimates and the sample values for the days that
were sampled
- [`plotConcTimeDaily()`](plotConcTimeDaily.md) : Plot of the time
series of daily concentration estimates and the sample values for the
days that were sampled
- [`plotConcQSmooth()`](plotConcQSmooth.md) : Plot up to three curves
representing the concentration versus discharge relationship. Each
curve is a different point in time.
- [`plotConcTimeSmooth()`](plotConcTimeSmooth.md) : Plot up to three
curves representing the concentration versus time relationship, each
curve representing a different flow.
- [`fluxBiasMulti()`](fluxBiasMulti.md) : Produces 8-panel plot that is
useful for determining if there is a flux bias problem
- [`plotContours()`](plotContours.md) : Color contour plot of the
estimated surfaces as a function of discharge and time (surfaces
include log concentration, standard error, and concentration)
- [`plotDiffContours()`](plotDiffContours.md) : Plots the difference
between two years from a contour plot created by plotContours
- [`plotWRTDSKalman()`](plotWRTDSKalman.md) : plotWRTDSKalman
- [`plotTimeSlice()`](plotTimeSlice.md) : plotTimeSlice
- [`plotMonthTrend()`](plotMonthTrend.md) : Plot monthly trend result
from runPairs
- [`flexPlotAddOn()`](flexPlotAddOn.md) : Flexible Flow Normalization
Plot Add On
- [`genericEGRETDotPlot()`](genericEGRETDotPlot.md) : Generic EGRET
plotting function
- [`generalAxis()`](generalAxis.md) : Axis generation for log discharge
- [`logPretty1()`](logPretty1.md) : Sets up tick marks for an axis with
a log scale, where the graph is small
- [`logPretty3()`](logPretty3.md) : Sets up tick marks for an axis with
a log scale
## Table
Functions for creating tables from eList objects
- [`printSeries()`](printSeries.md) : Print annual results for a given
streamflow statistic
- [`makeAnnualSeries()`](makeAnnualSeries.md) : Produces annual series
of 8 streamflow statistics (and a lowess smooth of them) from daily
streamflow data
- [`tableChange()`](tableChange.md)
[`tableChangeSingle()`](tableChange.md) : Create a table of the
changes in flow-normalized values between various points in time in
the record
- [`tableFlowChange()`](tableFlowChange.md) : Prints table of change
metrics for a given streamflow statistic
- [`tableResults()`](tableResults.md) : Table of annual results for
discharge, concentration and flux
- [`setupYears()`](setupYears.md) : Creates the AnnualResults data frame
from the Daily data frame
- [`calculateMonthlyResults()`](calculateMonthlyResults.md) : Calculates
monthly mean values of Q, Conc, FNConc, Flux, and FNFlux for the
entire record. If WRTDSKalman has been run it also includes the
monthly mean values of GenConc and GenFlux.
## Utilities
Additional utility functions
- [`blankTime()`](blankTime.md) : Deletes the computed values during
periods of time when there are no sample data
- [`cleanUp()`](cleanUp.md) : cleanUp eList
- [`compressData()`](compressData.md) : Compress sample data frame
- [`cumQdate()`](cumQdate.md) : Cumulative flow calculation
- [`genmissing()`](genmissing.md) : genmissing
- [`dataOverview()`](dataOverview.md) : Data Overview for WRTDS
- [`decimalDate()`](decimalDate.md) : decimalDate
- [`errorStats()`](errorStats.md) : Error statistics
- [`fixSampleFrame()`](fixSampleFrame.md) : Update Sample dataframe
- [`flowDuration()`](flowDuration.md) : Computes several values of the
flow duration curve for streamflow centered on a specific date of the
year
- [`fluxBiasStat()`](fluxBiasStat.md) : Compute the flux bias statistic:
(mean of estimated flux - mean of observed flux) / mean of estimated
flux
- [`printPairs()`](printPairs.md) : Print information about pairs
analysis
- [`printGroups()`](printGroups.md) : Print information about group
analysis
- [`getDaily()`](getDaily.md) : Get Daily dataframe from EGRET object
- [`getInfo()`](getInfo.md) : Get INFO dataframe from EGRET object
- [`getSample()`](getSample.md) [`getSample.default()`](getSample.md) :
Get Sample dataframe from EGRET object
- [`getSurfaces()`](getSurfaces.md) : Get surfaces matrix from EGRET
object
- [`jitterSam()`](jitterSam.md) : jitter Sample
- [`makeAugmentedSample()`](makeAugmentedSample.md) : Create randomized
residuals and observations for data sets that have some censored data
- [`mergeReport()`](mergeReport.md) : mergeReport
- [`print(`*``*`)`](helperEGRET.md)
[`plot(`*``*`)`](helperEGRET.md)
[`nDischarge()`](helperEGRET.md) [`nObservations()`](helperEGRET.md)
[`nCensoredVals()`](helperEGRET.md) : EGRET helper functions
- [`printFluxUnitCheatSheet()`](printFluxUnitCheatSheet.md) : Reminder
to user of flux unit properties (such as kg/day, tons/year, etc).
- [`printqUnitCheatSheet()`](printqUnitCheatSheet.md) : Reminder to user
of flow Unit properties such as cubic meters per second or thousands
of cubic feet per second.
- [`processQWData()`](processQWData.md) : Processing of Water Quality
Data
- [`randomSubset()`](randomSubset.md) : randomSubset
- [`removeDuplicates()`](removeDuplicates.md) : Remove duplicates values
from Sample data frame.
- [`saveResults()`](saveResults.md) : A utility program for saving the
contents of the workspace
- [`setPA()`](setPA.md) : Sets up the period of analysis (the portion of
the year being evaluated).
- [`stitch()`](stitch.md) : stitch surfaces
- [`triCube()`](triCube.md) : Tricube weight function
- [`censoredSegments()`](censoredSegments.md) : Generic plotting
function to create censored line segments
- [`checkStartEndDate()`](checkStartEndDate.md) : checkStartEndDate
- [`checkSurfaceSpan()`](checkSurfaceSpan.md) : checkSurfaceSpan
- [`Constants`](Constants.md) [`fluxConst`](Constants.md)
[`qConst`](Constants.md) [`monthInfo`](Constants.md)
[`concConst`](Constants.md) : Constants included with EGRET
- [`dateFormatCheck()`](dateFormatCheck.md) : Check date format
- [`decimalHighLow()`](decimalHighLow.md) : decimalHighLow
- [`makeDateInfo()`](makeDateInfo.md) : makeDateInfo
- [`populateConcentrations()`](populateConcentrations.md) : Populate
Concentration Columns
- [`populateDaily()`](populateDaily.md) : Populate Daily data frame
- [`populateDailySamp()`](populateDailySamp.md) : Merge concentration to
Daily
- [`populateDateColumns()`](populateDateColumns.md) : Populate Date
Columns
- [`populateParameterINFO()`](populateParameterINFO.md) : Populate
Parameter Information Columns
- [`populateSampleColumns()`](populateSampleColumns.md) : Populate
Sample Columns
- [`populateSiteINFO()`](populateSiteINFO.md) : Populate Site
Information Columns
- [`qUnit-class`](qUnit-class.md) : qUnit class
- [`concUnit-class`](concUnit-class.md) : concUnit class
- [`readDataFromFile()`](readDataFromFile.md) : Basic Data Import for
Water Flow Data
- [`Choptank_eList`](sampleData.md) [`Arkansas_eList`](sampleData.md) :
Example eList
- [`selectDays()`](selectDays.md) : Creates a subset Daily data frame
that only contains daily estimates for the specified period of
analysis
- [`setSeasonLabel()`](setSeasonLabel.md) : Create a character variable
that describes the period of analysis, when period of analysis has
already been set in AnnualResults
- [`setSeasonLabelByUser()`](setSeasonLabelByUser.md) : Creates a
character variable that describes the period of analysis, when the
period of analysis is being set by the user and not from AnnualResults
- [`startEnd()`](startEnd.md) : startEnd
- [`surfaceIndex()`](surfaceIndex.md) : Compute the 6 parameters needed
to lay out the grid for the surfaces computed in estSurfaces
- [`surfaceStartEnd()`](surfaceStartEnd.md) : Surface date limits
- [`yPretty()`](yPretty.md) : Sets up tick marks for an axis for a graph
with an arithmetic scale which starts at zero
- [`monthLabel-class`](monthLabel-class.md) : monthLabel class
- [`is.egret()`](is.egret.md) : Check for EGRET object
- [`as.egret()`](as.egret.md) : Create named list for EGRET analysis
- [`EGRET`](EGRET-package.md) [`EGRET-package`](EGRET-package.md) :
EGRET package includes WRTDS and flowHistory
- [`fluxUnit-class`](fluxUnit-class.md) : fluxUnit class
- [`fill_missing_daily()`](fill_missing_daily.md) : Fill missing daily
data
- [`fillUpElists()`](fillUpElists.md) : fillUpElists
- [`precompute_L()`](precompute_L.md) : precompute_L
# Articles
### All vignettes
- [Using a WRTDS model where the discharge variable is not daily
discharge](AlternativeQMethod.md):
- [Annual Hydrograph Timing](Annual_Hydrograph_Timing.md):
- [Compare discrete and sensor values](Compare_QW_and_UV.md):
- [Daily and Sample retrieval updates](data_retrieval_updates.md):
- [Data Preperation](dataPreperation.md):
- [Introduction to the EGRET package](EGRET.md):
- [Guide to EGRET 3.0 enhancements](Enhancements.md):
- [Joining by the closest date](Join_closest.md):
- [EGRET Overview and Update](Overview.md):
- [Running WRTDS in parallel](parallel.md):
- [WRTDS Bibliography](References_WRTDS.md):
- [Randomized Censored Data](rResid.md):
- [Seasonal Analysis in EGRET](SeasonalFraction.md):
- [Daily Streamflow Trend Analysis](streamflow_trend.md):
- [Trends by month](TrendsByMonth.md):
- [Custom Axis Labels](units.md):
- [WRTDS Kalman](WRTDSK.md):