Note
Go to the end to download the full example code.
Distribution Class
Handles the initialization of different statistical distribution
from geobipy import Distribution
from geobipy import plotting as cP
import matplotlib.pyplot as plt
import numpy as np

from numpy.random import Generator
from numpy.random import PCG64DXSM
generator = PCG64DXSM(seed=0)
prng = Generator(generator)
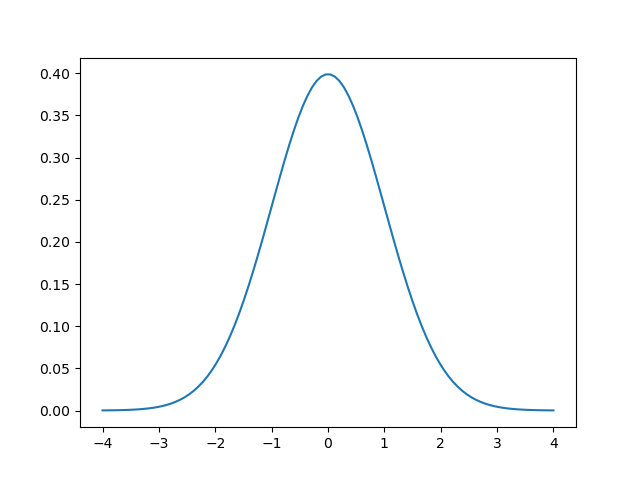
Univariate Normal Distribution
D = Distribution('Normal', 0.0, 1.0, prng=prng)

# Get the bins of the Distribution from +- 4 standard deviations of the mean
bins = D.bins()

# Grab random samples from the distribution
D.rng(10)

# We can then get the Probability Density Function for those bins
pdf = D.probability(bins, log=False)

# And we can plot that PDF
plt.figure()
plt.plot(bins, pdf)

[<matplotlib.lines.Line2D object at 0x14557e4b0>]
Multivariate Normal Distribution
D = Distribution('MvNormal',[0.0,1.0,2.0],[1.0,1.0,1.0], prng=prng)
D.rng()
array([ 0.64050649, 1.77177243, -0.34500474])
Uniform Distribution
D = Distribution('Uniform', 0.0, 1.0, prng=prng)
D.bins()
DataArray([0.        , 0.01010101, 0.02020202, 0.03030303, 0.04040404,
           0.05050505, 0.06060606, 0.07070707, 0.08080808, 0.09090909,
           0.1010101 , 0.11111111, 0.12121212, 0.13131313, 0.14141414,
           0.15151515, 0.16161616, 0.17171717, 0.18181818, 0.19191919,
           0.2020202 , 0.21212121, 0.22222222, 0.23232323, 0.24242424,
           0.25252525, 0.26262626, 0.27272727, 0.28282828, 0.29292929,
           0.3030303 , 0.31313131, 0.32323232, 0.33333333, 0.34343434,
           0.35353535, 0.36363636, 0.37373737, 0.38383838, 0.39393939,
           0.4040404 , 0.41414141, 0.42424242, 0.43434343, 0.44444444,
           0.45454545, 0.46464646, 0.47474747, 0.48484848, 0.49494949,
           0.50505051, 0.51515152, 0.52525253, 0.53535354, 0.54545455,
           0.55555556, 0.56565657, 0.57575758, 0.58585859, 0.5959596 ,
           0.60606061, 0.61616162, 0.62626263, 0.63636364, 0.64646465,
           0.65656566, 0.66666667, 0.67676768, 0.68686869, 0.6969697 ,
           0.70707071, 0.71717172, 0.72727273, 0.73737374, 0.74747475,
           0.75757576, 0.76767677, 0.77777778, 0.78787879, 0.7979798 ,
           0.80808081, 0.81818182, 0.82828283, 0.83838384, 0.84848485,
           0.85858586, 0.86868687, 0.87878788, 0.88888889, 0.8989899 ,
           0.90909091, 0.91919192, 0.92929293, 0.93939394, 0.94949495,
           0.95959596, 0.96969697, 0.97979798, 0.98989899, 1.        ])
Total running time of the script: (0 minutes 3.202 seconds)