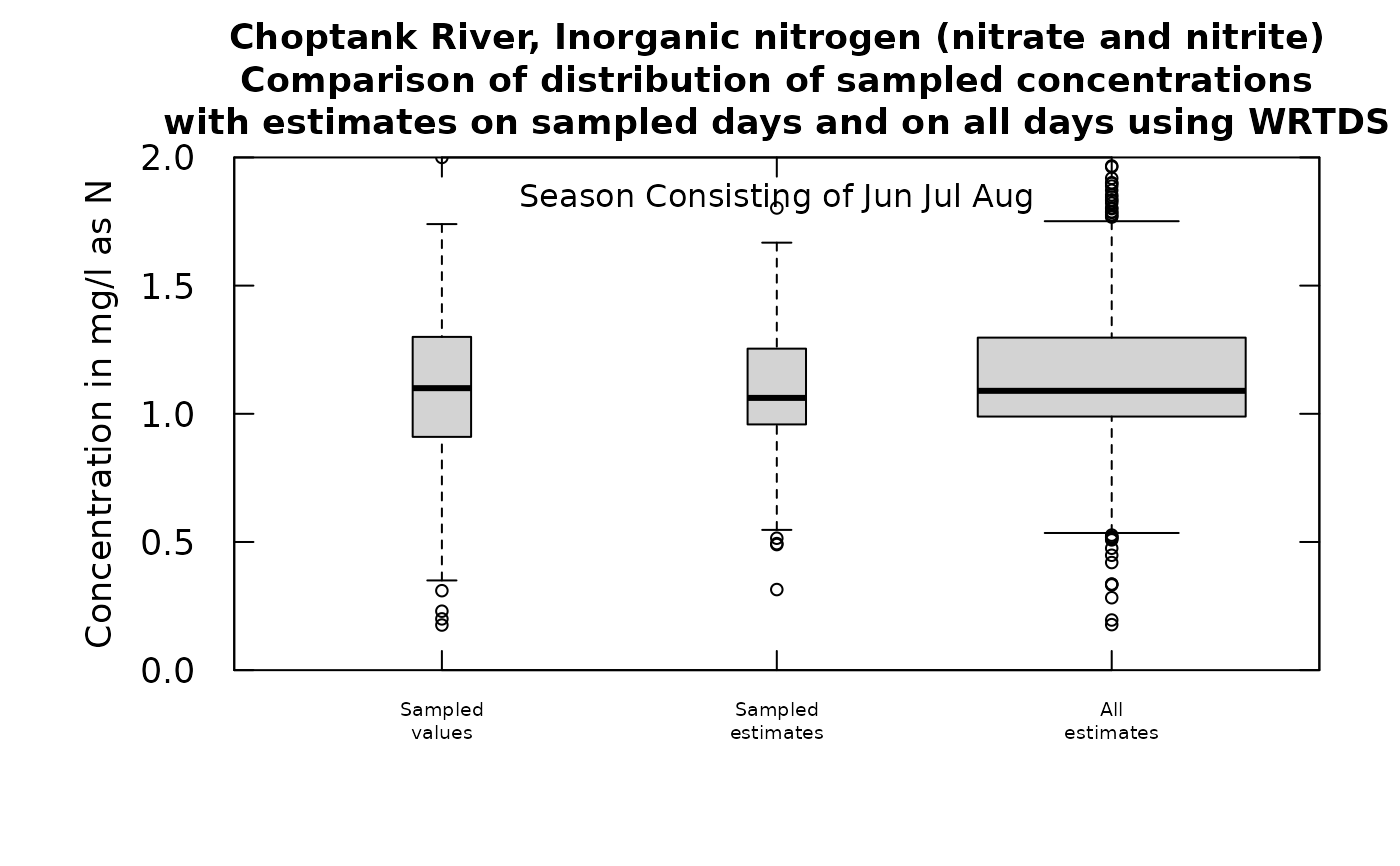
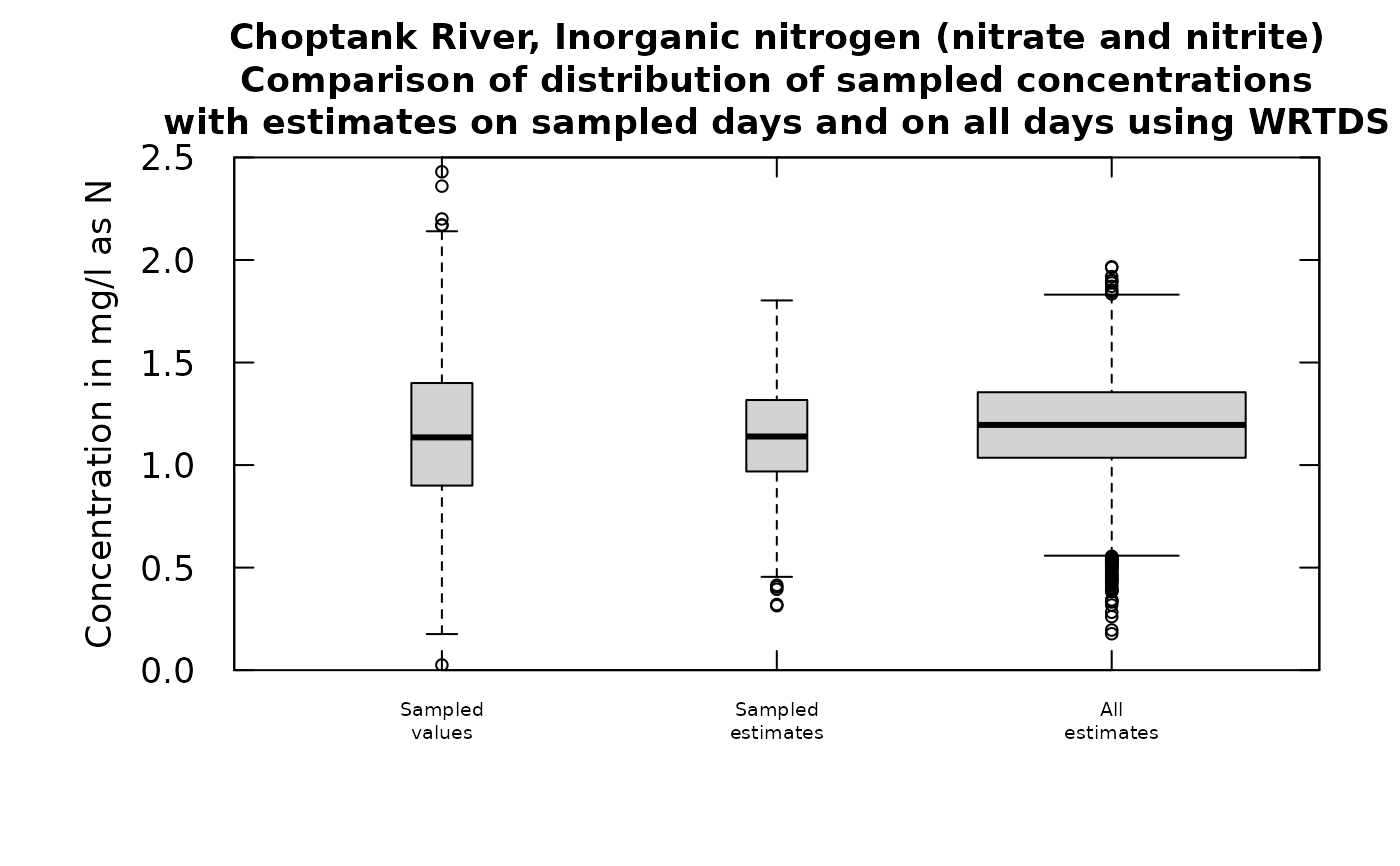
This function is used to compare the distribution of concentration in the sample and predicted data set. It shows three boxplots. One for the sample, one for the predictions on days with sample values, and one for all days (whether or not they had sample values). Box widths are proportional to the square root of the number of observations represented by the box.
Data come from named list, which contains a Sample dataframe with the sample data, a Daily dataframe with the daily flow data, and an INFO dataframe with metadata.
Although there are a lot of optional arguments to this function, most are set to a logical default.
Usage
boxConcThree(eList, tinyPlot = FALSE, printTitle = TRUE,
  moreTitle = "WRTDS", customPar = FALSE, font.main = 2, cex = 0.8,
  cex.main = 1.1, cex.axis = 1.1, concLab = 1, ...)
Arguments
- eList
named list with at least the Daily, Sample, and INFO dataframes
- tinyPlot
logical variable, if TRUE plot is designed to be plotted small as part of a multi-plot figure, default is FALSE.
- printTitle
logical variable if TRUE title is printed, if FALSE not printed (this is best for a multi-plot figure)
- moreTitle
character specifying some additional information to go in figure title, typically some information about the specific estimation method used, default is no additional information
- customPar
logical defaults to FALSE. If TRUE, par() should be set by user before calling this function
- font.main
font to be used for plot main titles
- cex
numerical value giving the amount by which plotting symbols should be magnified
- cex.main
magnification to be used for main titles relative to the current setting of cex
- cex.axis
magnification to be used for axis annotation relative to the current setting of cex
- concLab
object of concUnit class, or numeric represented the short code, or character representing the descriptive name. By default, this argument sets concentration labels to use either Concentration or Conc (for tiny plots). Units are taken from the eList$INFO$param.units. To use any other words than "Concentration" see
vignette(topic = "units", package = "EGRET").- ...
arbitrary graphical parameters that will be passed to genericEGRETDotPlot function (see ?par for options)
Examples
eList <- Choptank_eList
# Water year:
boxConcThree(eList)

# Graphs consisting of Jun-Aug
eList <- setPA(eList, paStart=6,paLong=3)
boxConcThree(eList)
# Graphs consisting of Jun-Aug
eList <- setPA(eList, paStart=6,paLong=3)
boxConcThree(eList)