Single site groundwater level plots and tables
gwl_plot_field.RdFunction to create the field groundwater level data plot.
Usage
gwl_plot_field(
  gwl_data,
  plot_title = "",
  parameter_cd = NA,
  date_col = "time",
  value_col = "value",
  approved_col = "approval_status",
  flip = TRUE,
  y_label = "",
  subtitle = "U.S. Geological Survey"
)

gwl_plot_all(
  gw_level_dv,
  gwl_data,
  parameter_cd = NA,
  date_col = c("time", "time"),
  value_col = c("value", "value"),
  approved_col = c("approval_status", "approval_status"),
  y_label = "",
  subtitle = "U.S. Geological Survey",
  plot_title = "",
  add_trend = FALSE,
  n_years = 10,
  POR_trend = TRUE,
  flip = FALSE,
  days_required_per_month = 14
)
Arguments
- gwl_data
data frame returned from
read_waterdata_field_measurements, or data frame with a date, value, and approval columns. UseNULLfor no discrete data.- plot_title
character, title for plot.
- parameter_cd
Can be used to filter data if the data frame has a "parameter_code" column. The default is
NA, which will not do any filtering. If the gwl_data and gw_level_dv need different parameter code filtering, use a vector of 2 parameter codes. The first one will filter the gw_level_dv data frame, the second will filter the gwl_data data frame.- date_col
the name of the time columns. The first value is associated with the gw_level_dv input, and the second value is associated with the gwl_data input. The default is
c("time", "time").- value_col
the name of the value columns. The first value is associated with the gw_level_dv input, and the second value is associated with the gwl_data input. The default is
c("value", "value").- approved_col
the name of the column to get provisional/approved status. The first value is associated with the gw_level_dv input, and the second value is associated with the gwl_data input. The default is
c("approval_status", "approval_status"). It is expected that these columns will have only "Approved" or "Provisional".- flip
logical. If
TRUE, flips labels so that the lower numbers are in the higher percentages. Default isTRUE.- y_label
character for y-axis label. Consider using
read_waterdata_parameter_codesfor USGS parameter_name.- subtitle
character. Sub-title for plot, default is "U.S. Geological Survey".
- gw_level_dv
data frame, daily groundwater level data. Often obtained from
read_waterdata_daily. UseNULLfor no daily data.- add_trend
logical. Uses
trend_test.- n_years
integer. This is the number of years to calculate the trend on. Default is 10. This can be a vector of years.
- POR_trend
a logical indicating whether to include a trend test for the full period of record. Default is
TRUE.- days_required_per_month
integer. Number of days required per month. Default is 14. Only used if add_trend is
TRUEusing daily data.
Examples
site <- "USGS-263819081585801"
# gwl_data <- dataRetrieval::read_waterdata_field_measurements(monitoring_location_id = site)
gwl_data <- L2701_example_data$Discrete
pcodes <- dataRetrieval::read_waterdata_parameter_codes(
parameter_code = unique(gwl_data$parameter_code)
)
#> Current API functionality requires pulling the full parameter-codes list.
#> It is expected that updates to the API will eliminate this need, but in the meantime
#> consider running read_waterdata_parameter_code() with no query parameters, and filtering
#> in a post-processing step.
#> Requesting:
#> https://api.waterdata.usgs.gov/ogcapi/v0/collections/parameter-codes/items?f=json&lang=en-US&skipGeometry=TRUE&limit=10000
#> Remaining requests this hour:2634
#> Remaining requests this hour:2633
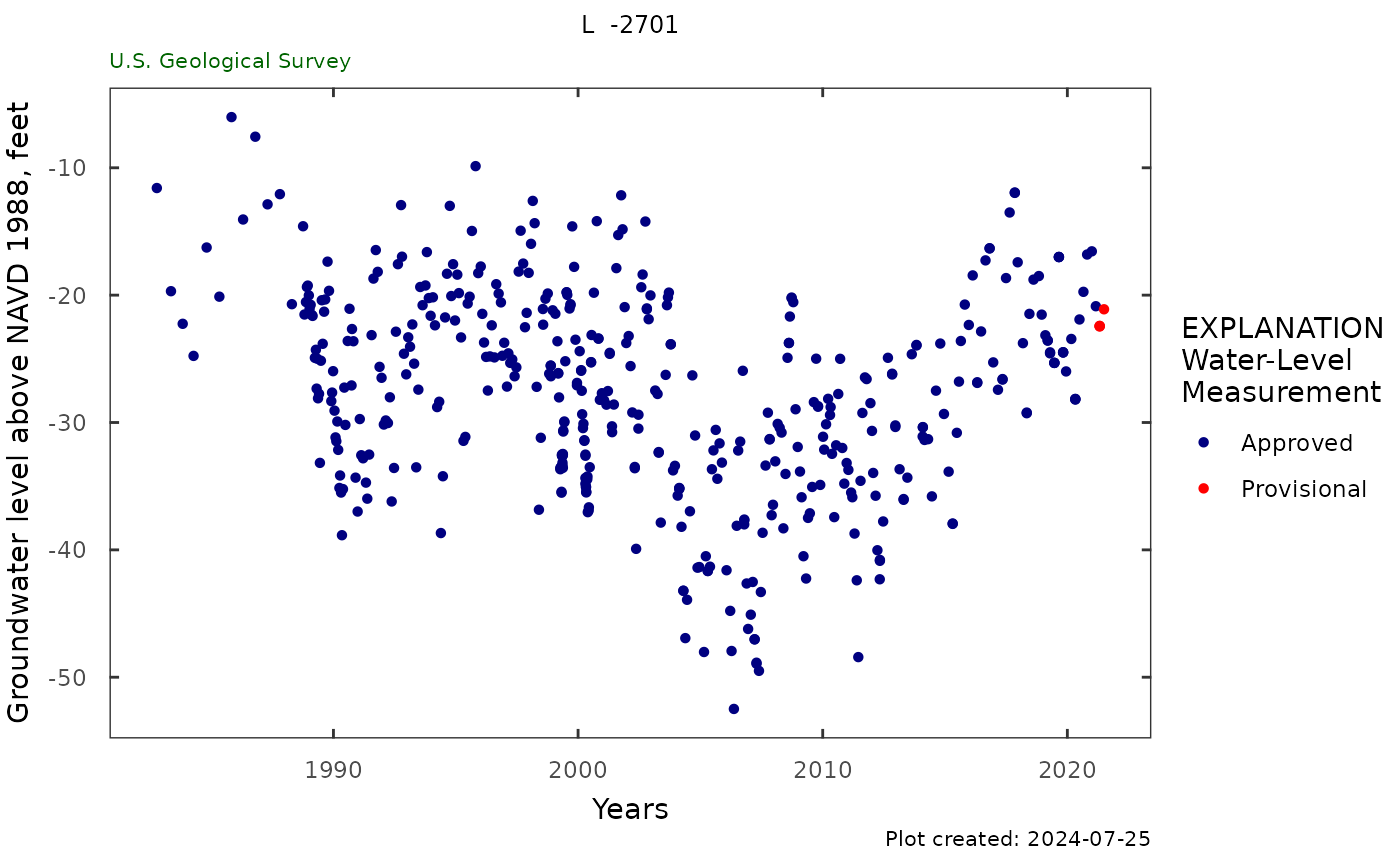
gwl_plot_field(gwl_data,
plot_title = "L2701_example",
parameter_cd = "62610",
flip = FALSE,
y_label = pcodes$parameter_name[pcodes$parameter_code == "62610"])
 gwl_plot_field(gwl_data,
plot_title = "L2701_example",
y_label = pcodes$parameter_name[pcodes$parameter_code == "62611"],
parameter_cd = "62611",
flip = FALSE)
gwl_plot_field(gwl_data,
plot_title = "L2701_example",
y_label = pcodes$parameter_name[pcodes$parameter_code == "62611"],
parameter_cd = "62611",
flip = FALSE)
 gwl_plot_field(gwl_data,
plot_title = "L2701_example",
y_label = pcodes$parameter_name[pcodes$parameter_code == "72019"],
parameter_cd = "72019",
flip = TRUE)
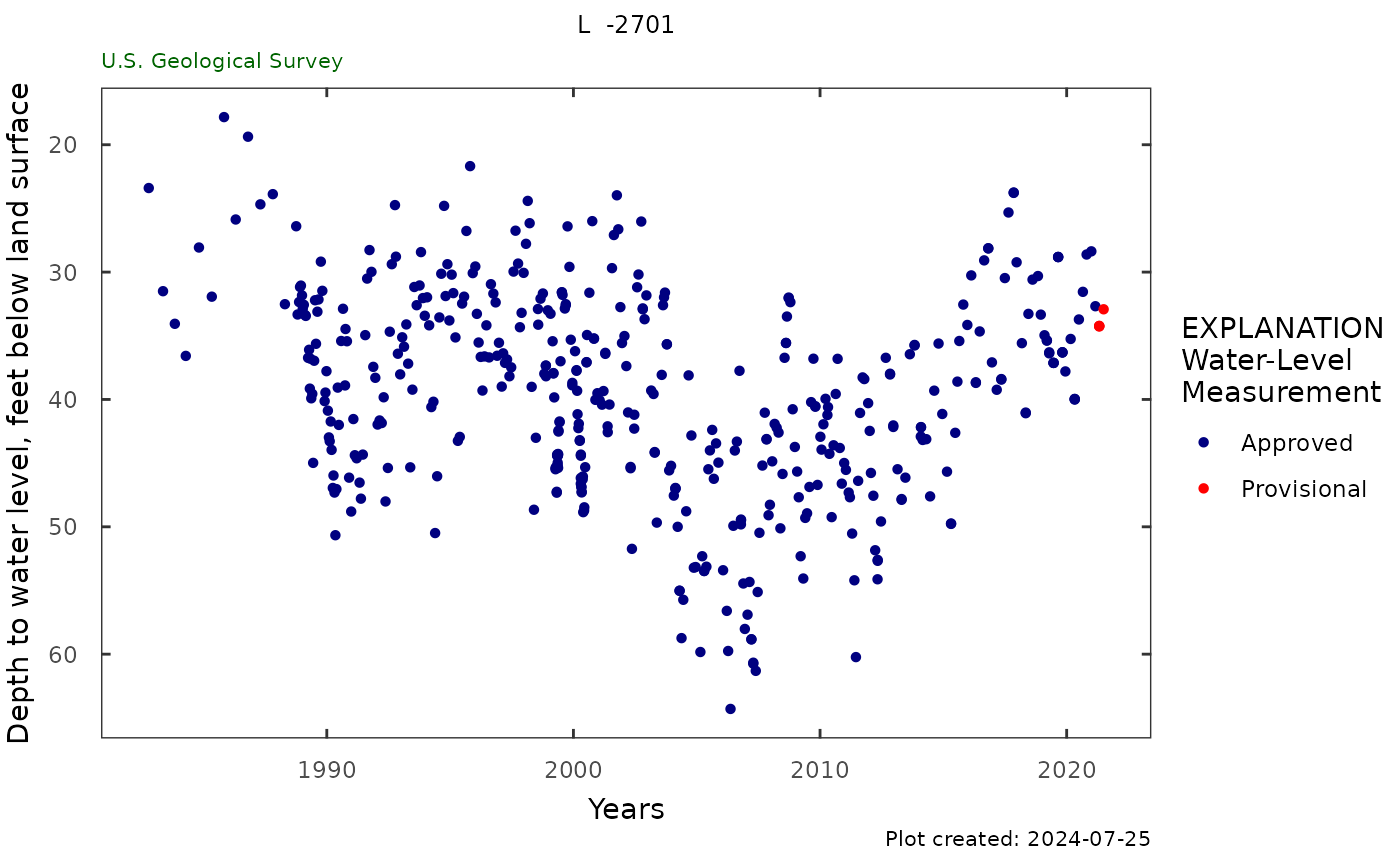
gwl_plot_field(gwl_data,
plot_title = "L2701_example",
y_label = pcodes$parameter_name[pcodes$parameter_code == "72019"],
parameter_cd = "72019",
flip = TRUE)
 site <- "USGS-263819081585801"
p_code_dv <- "62610"
statCd <- "00001"
# gw_level_dv <- dataRetrieval::read_waterdata_daily(monitoring_location_id = site,
# parameter_code = p_code_dv,
# statistic_id = statCd)
gw_level_dv <- L2701_example_data$Daily
site_info <- dataRetrieval::read_waterdata_monitoring_location(monitoring_location_id = site)
#> Requesting:
#> https://api.waterdata.usgs.gov/ogcapi/v0/collections/monitoring-locations/items?f=json&lang=en-US&limit=10000&id=USGS-263819081585801
#> Remaining requests this hour:2627
plot_title <- site_info$monitoring_location_name
pcodes <- dataRetrieval::read_waterdata_parameter_codes(parameter_code = p_code_dv)
#> Requesting:
#> https://api.waterdata.usgs.gov/ogcapi/v0/collections/parameter-codes/items?f=json&lang=en-US&skipGeometry=TRUE&limit=10000&id=62610
#> Remaining requests this hour:2627
gwl_plot_all(gw_level_dv,
NULL,
plot_title = plot_title,
y_label = pcodes$parameter_name,
flip = TRUE)
site <- "USGS-263819081585801"
p_code_dv <- "62610"
statCd <- "00001"
# gw_level_dv <- dataRetrieval::read_waterdata_daily(monitoring_location_id = site,
# parameter_code = p_code_dv,
# statistic_id = statCd)
gw_level_dv <- L2701_example_data$Daily
site_info <- dataRetrieval::read_waterdata_monitoring_location(monitoring_location_id = site)
#> Requesting:
#> https://api.waterdata.usgs.gov/ogcapi/v0/collections/monitoring-locations/items?f=json&lang=en-US&limit=10000&id=USGS-263819081585801
#> Remaining requests this hour:2627
plot_title <- site_info$monitoring_location_name
pcodes <- dataRetrieval::read_waterdata_parameter_codes(parameter_code = p_code_dv)
#> Requesting:
#> https://api.waterdata.usgs.gov/ogcapi/v0/collections/parameter-codes/items?f=json&lang=en-US&skipGeometry=TRUE&limit=10000&id=62610
#> Remaining requests this hour:2627
gwl_plot_all(gw_level_dv,
NULL,
plot_title = plot_title,
y_label = pcodes$parameter_name,
flip = TRUE)
 # gwl_data <- dataRetrieval::read_waterdata_field_measurements(monitoring_location_id = site)
gwl_data <- L2701_example_data$Discrete
gwl_plot_all(gw_level_dv,
gwl_data,
parameter_cd = "62610",
plot_title = plot_title,
y_label = pcodes$parameter_name,
add_trend = FALSE,
flip = FALSE)
# gwl_data <- dataRetrieval::read_waterdata_field_measurements(monitoring_location_id = site)
gwl_data <- L2701_example_data$Discrete
gwl_plot_all(gw_level_dv,
gwl_data,
parameter_cd = "62610",
plot_title = plot_title,
y_label = pcodes$parameter_name,
add_trend = FALSE,
flip = FALSE)
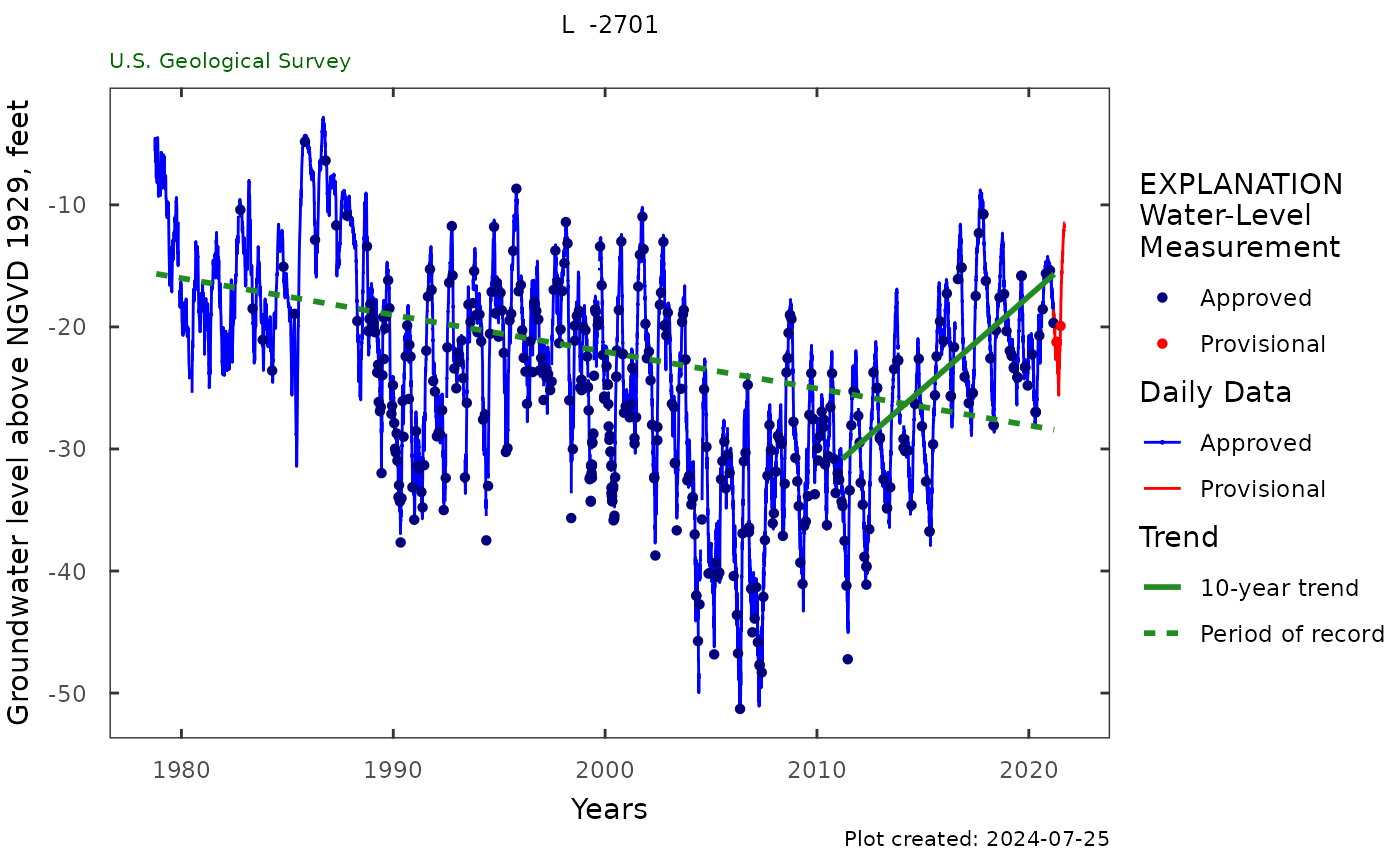 gwl_plot_all(gw_level_dv,
gwl_data,
parameter_cd = "62610",
n_years = c(5, 20),
POR_trend = TRUE,
y_label = pcodes$parameter_name,
plot_title = plot_title,
add_trend = TRUE)
gwl_plot_all(gw_level_dv,
gwl_data,
parameter_cd = "62610",
n_years = c(5, 20),
POR_trend = TRUE,
y_label = pcodes$parameter_name,
plot_title = plot_title,
add_trend = TRUE)
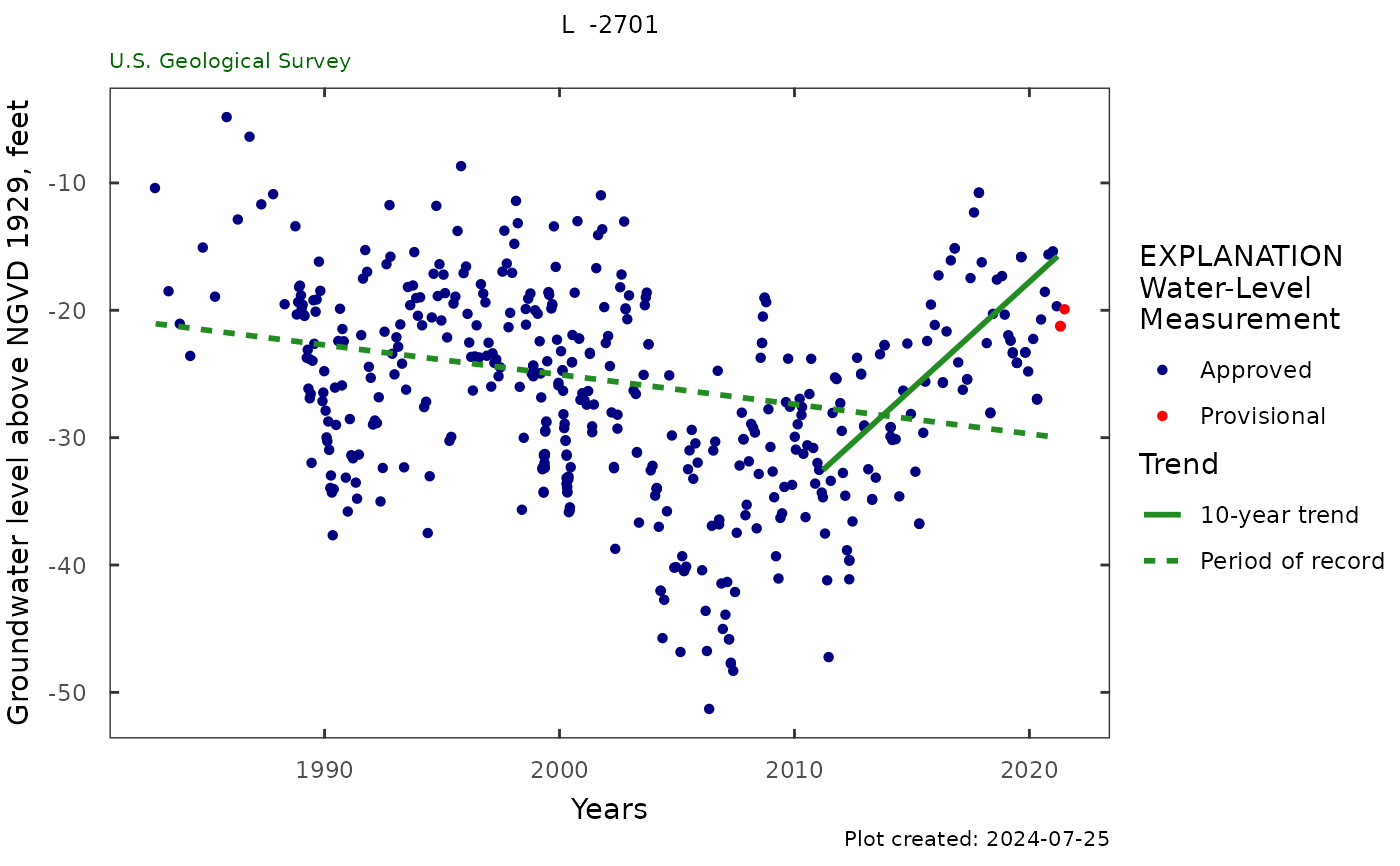
 gwl_plot_all(NULL,
gwl_data,
parameter_cd = "62610",
plot_title = plot_title,
y_label = pcodes$parameter_name)
gwl_plot_all(NULL,
gwl_data,
parameter_cd = "62610",
plot_title = plot_title,
y_label = pcodes$parameter_name)
 gwl_plot_all(NULL,
gwl_data,
parameter_cd = "62610",
plot_title = plot_title,
y_label = pcodes$parameter_name,
add_trend = TRUE)
gwl_plot_all(NULL,
gwl_data,
parameter_cd = "62610",
plot_title = plot_title,
y_label = pcodes$parameter_name,
add_trend = TRUE)