Plot composite hydrograph data
plot_composite_data.RdCreate composite hydrograph plot
Usage
plot_composite_data(
  x,
  num_years = NA,
  parameter_cd = "72019",
  plot_title = "",
  subtitle = "U.S. Geological Survey"
)
Arguments
- x
aquifer data frame. Requires at least 3 columns: "monitoring_location_id", "year", and "value".
- num_years
integer number of years required. If
NA, the analysis will default to the range of the data in x.- parameter_cd
character, 5-digit parameter code, default is "72019".
- plot_title
character title included on plot.
- subtitle
character. Sub-title for plot, default is "U.S. Geological Survey".
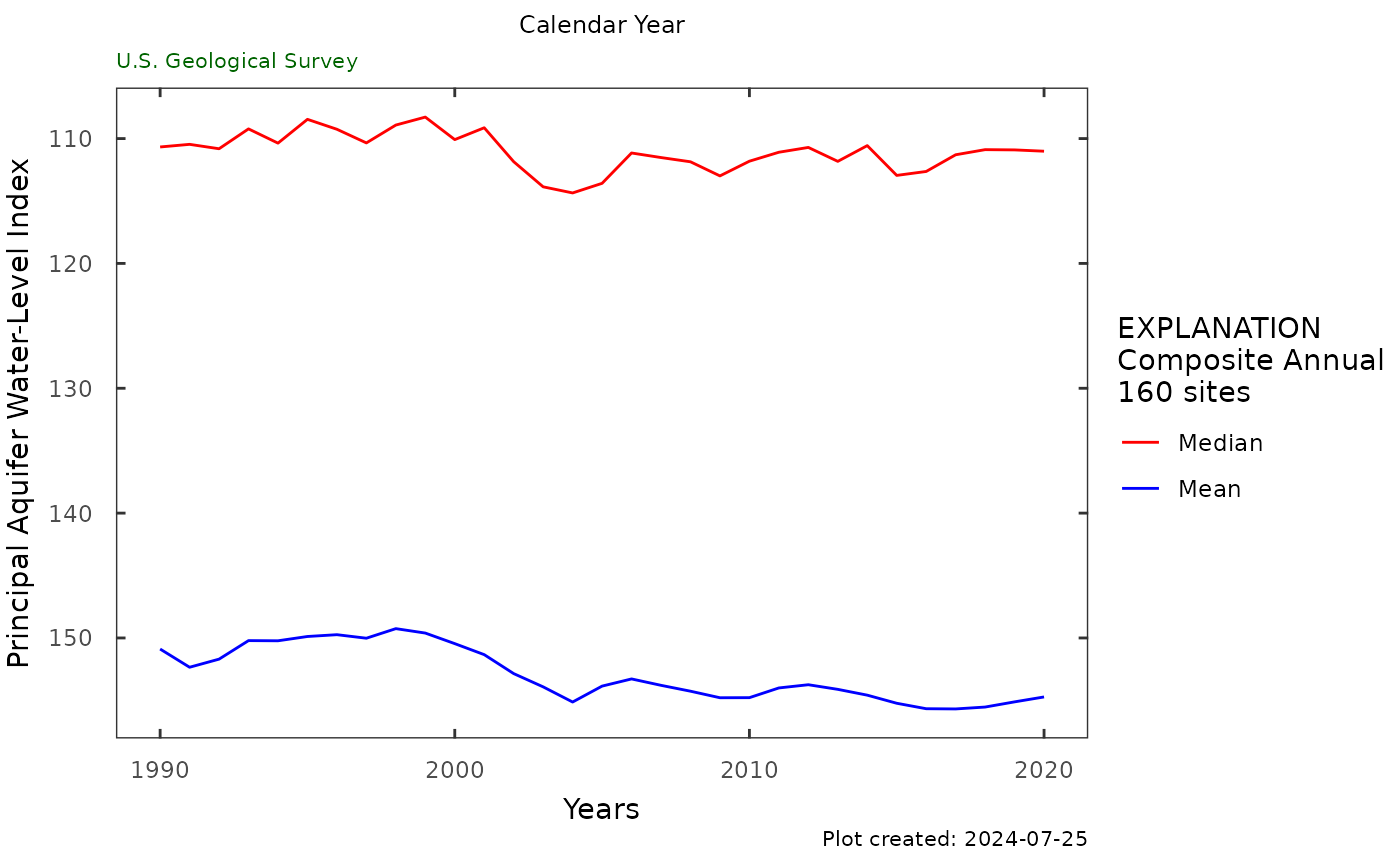
Examples
aquifer_data <- aquifer_data
comp_data <- plot_composite_data(aquifer_data,
num_years = 30,
parameter_cd = "72019",
plot_title = "Calendar Year")
comp_data
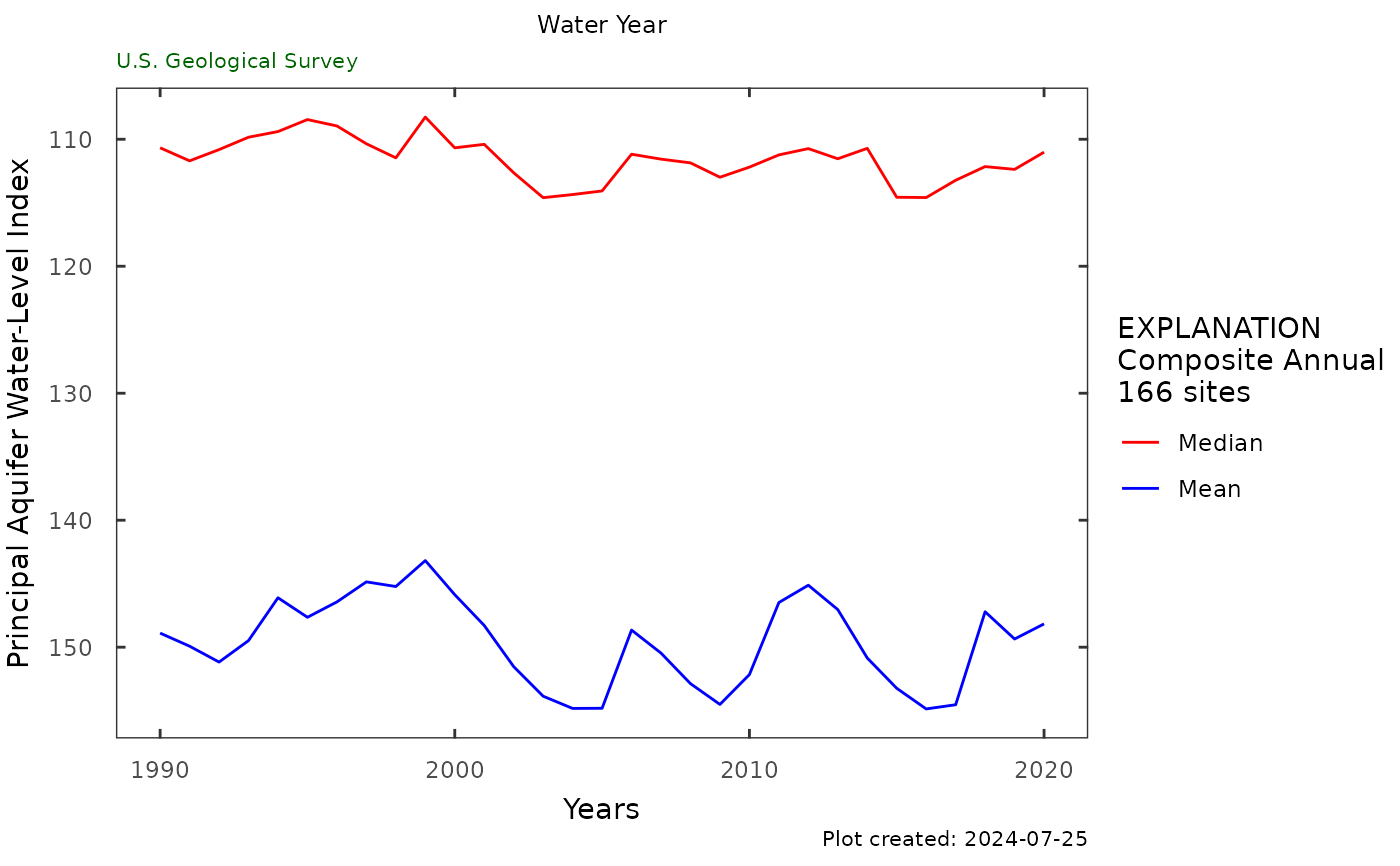
 # Do it on a water year:
aquifer_data$cal_year <- aquifer_data$year
aquifer_data$year <- aquifer_data$water_year
plot_composite_data(aquifer_data,
parameter_cd = "72019",
num_years = 30,
plot_title = "Water Year")
# Do it on a water year:
aquifer_data$cal_year <- aquifer_data$year
aquifer_data$year <- aquifer_data$water_year
plot_composite_data(aquifer_data,
parameter_cd = "72019",
num_years = 30,
plot_title = "Water Year")