Specific conductance and chloride
sc_cl.RdFunctions to create the individual chloride, specific conductance, and combination plots and tables for a single site.
Usage
Sc_Cl_plot(qw_data, plot_title, subtitle = "U.S. Geological Survey")

Sc_Cl_table(qw_data)

qw_plot(
  qw_data,
  plot_title,
  y_label = NA,
  CharacteristicName = "Chloride",
  start_date = NA,
  end_date = NA,
  subtitle = "U.S. Geological Survey"
)

qw_summary(qw_data, CharacteristicName, norm_range = NA)
Arguments
- qw_data
data frame returned from
readWQPqw, must include columns "ActivityStartDateTime", "CharacteristicName", and "ResultMeasureValue"- plot_title
character title for plot
- subtitle
character. Sub-title for plot, default is "U.S. Geological Survey".
- y_label
character label for y axis. If left as NA, the function will attempt to use the "variableInfo" attribute of qw_data. This is attached to dataRetrieval output.
- CharacteristicName
character CharacteristicName to filter to.
- start_date
Date to start plot. If
NA(which is the default), the plot will start at the earliest measurement.- end_date
Date to end plot. If
NA(which is the default), the plot will end with the latest measurement.- norm_range
a numerical range to potentially group the data. If NA, no grouping is shown.
Examples
# site <- "USGS-263819081585801"
# parameterCd <- c("00095","90095","00940","99220")
# site_data <- dataRetrieval::readWQPqw(site,
# parameterCd)
# Using package example data:
qw_data <- L2701_example_data$QW
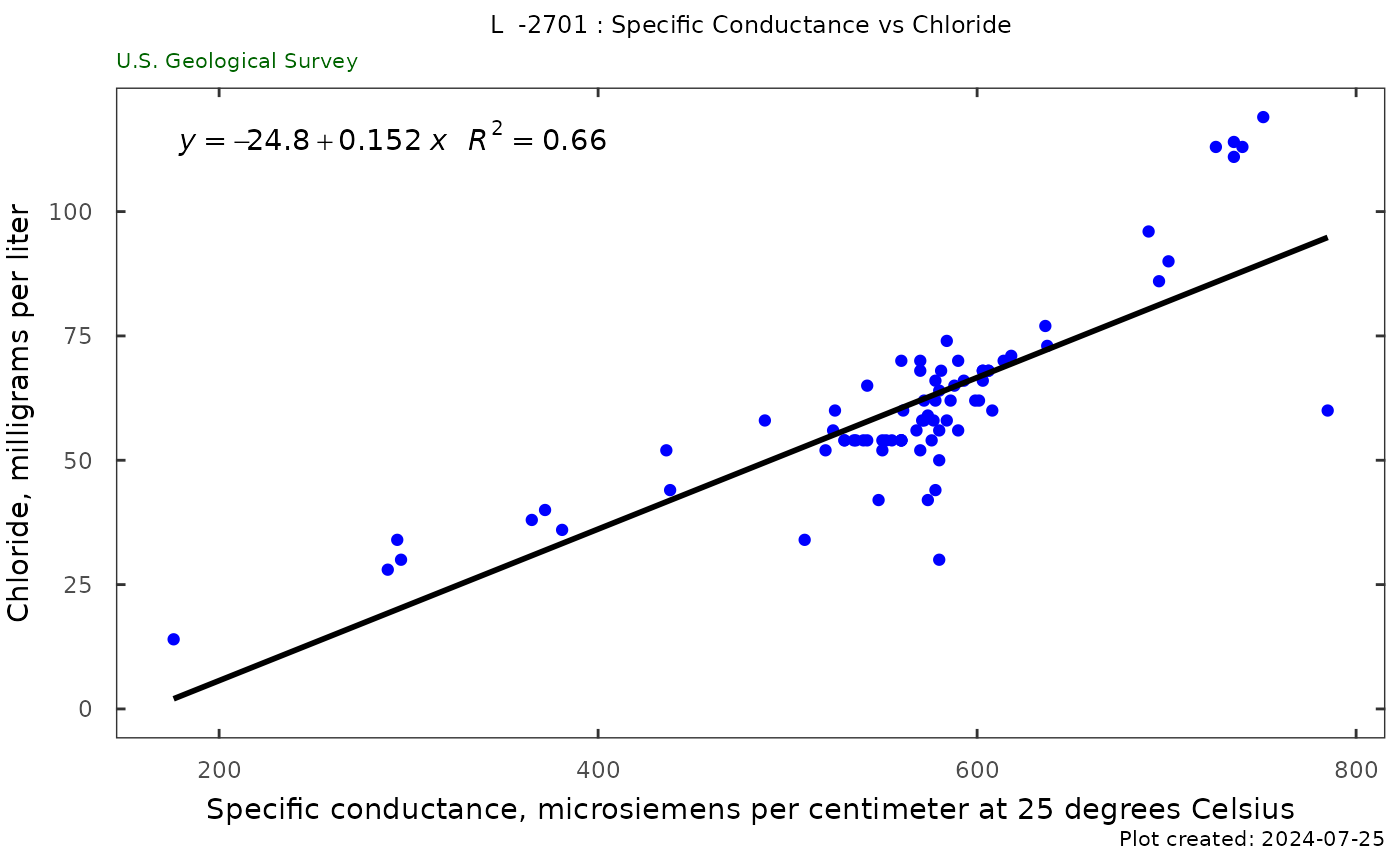
plot_title <- paste("USGS-263819081585801",
": Specific Conductance vs Chloride")
Sc_Cl_plot(qw_data, plot_title)
#> Requesting:
#> https://api.waterdata.usgs.gov/ogcapi/v0/collections/parameter-codes/items?f=json&lang=en-US&skipGeometry=TRUE&limit=10000&id=99220
#> Remaining requests this hour:2620
#> Requesting:
#> https://api.waterdata.usgs.gov/ogcapi/v0/collections/parameter-codes/items?f=json&lang=en-US&skipGeometry=TRUE&limit=10000&id=90095
#> Remaining requests this hour:2620
#> Warning: The dot-dot notation (`..eq.label..`) was deprecated in ggplot2 3.4.0.
#> ℹ Please use `after_stat(eq.label)` instead.
#> ℹ The deprecated feature was likely used in the HASP package.
#> Please report the issue at <https://code.usgs.gov/water/stats/hasp/-/issues>.
#> Warning: Removed 306 rows containing non-finite outside the scale range
#> (`stat_smooth()`).
#> Warning: Removed 306 rows containing non-finite outside the scale range
#> (`stat_poly_eq()`).
#> Warning: Removed 306 rows containing missing values or values outside the scale range
#> (`geom_point()`).
 sc_cl <- Sc_Cl_table(qw_data)
plot_title <- paste("USGS-263819081585801",
": Specific Conductance vs Chloride")
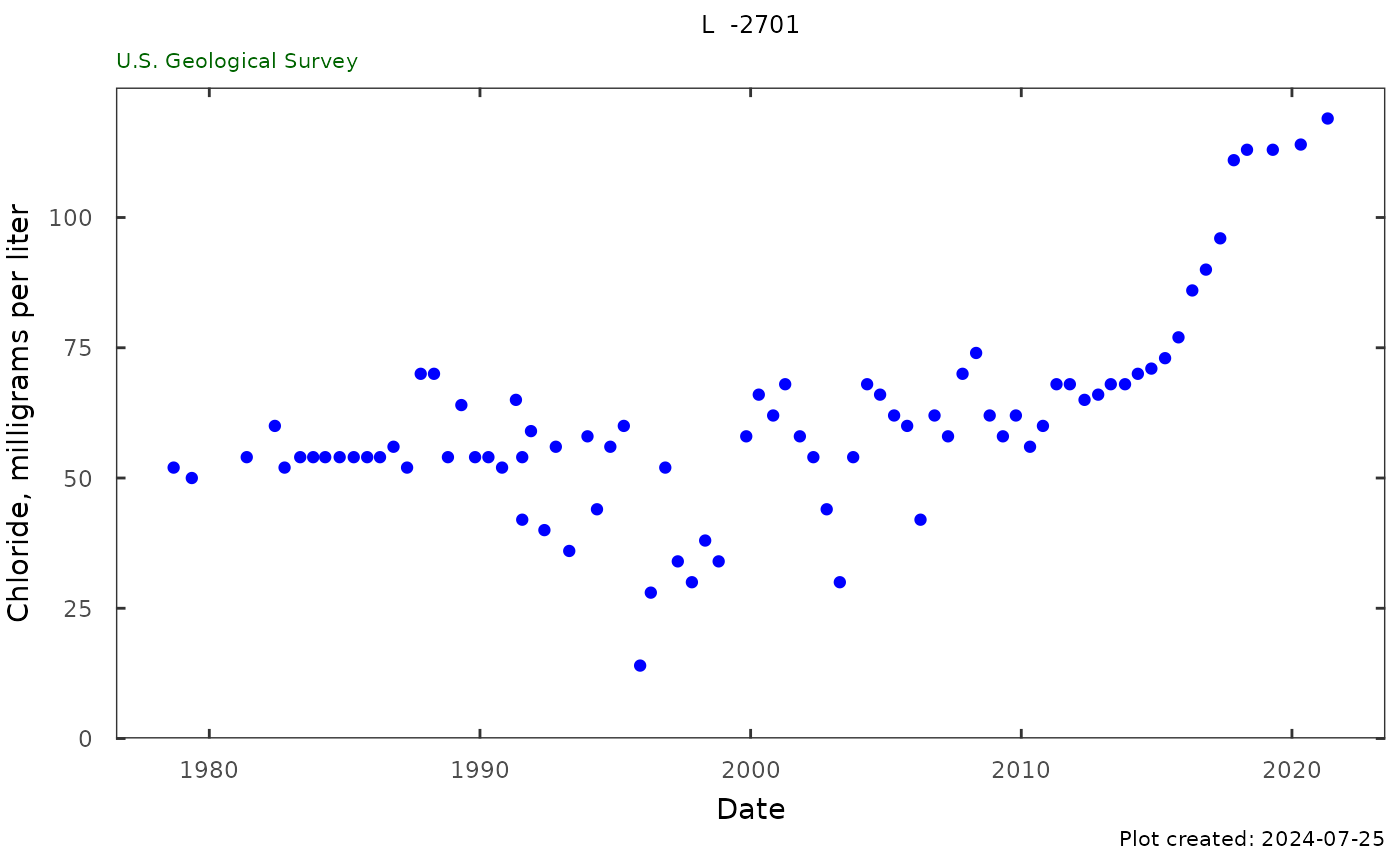
qw_plot(qw_data, plot_title, CharacteristicName = "Chloride")
sc_cl <- Sc_Cl_table(qw_data)
plot_title <- paste("USGS-263819081585801",
": Specific Conductance vs Chloride")
qw_plot(qw_data, plot_title, CharacteristicName = "Chloride")
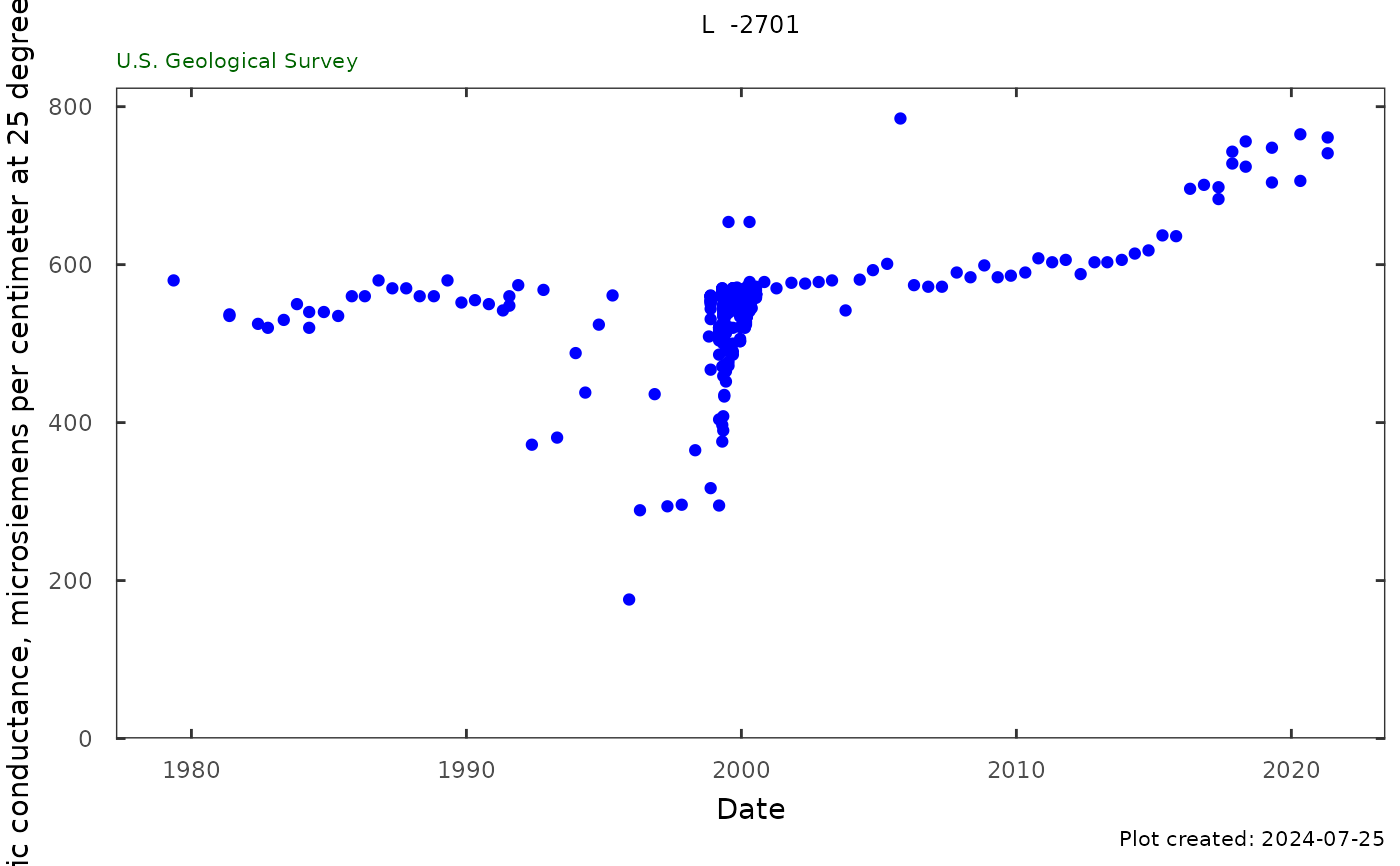
 qw_plot(qw_data, plot_title, CharacteristicName = "Specific conductance")
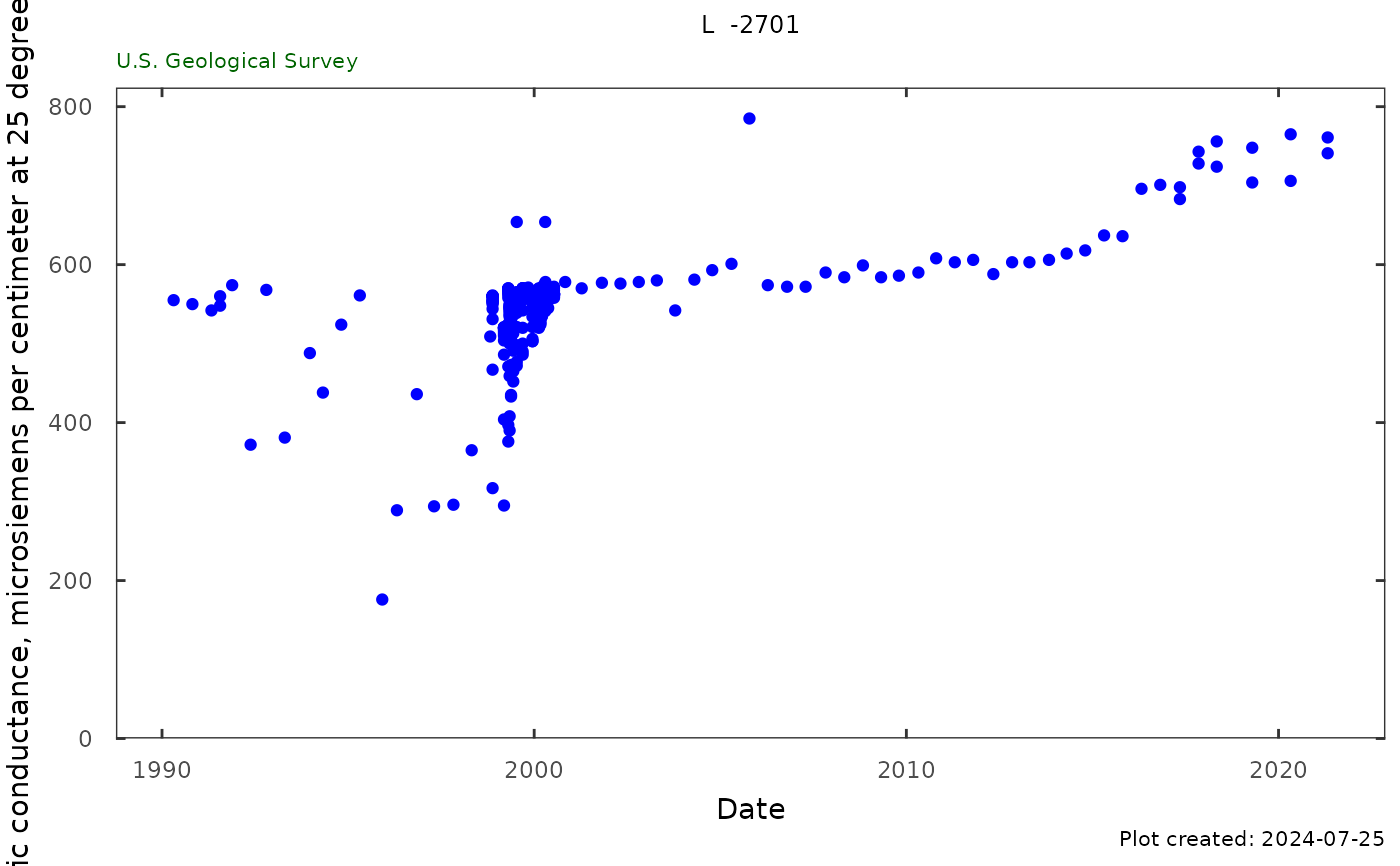
 qw_plot(qw_data,
plot_title,
CharacteristicName = "Specific conductance",
start_date = "1990-01-01")
qw_plot(qw_data,
plot_title,
CharacteristicName = "Specific conductance",
start_date = "1990-01-01")
 site <- "USGS-01491000"
qw_data_phos <- dataRetrieval::readWQPqw(site, "Orthophosphate")
#> GET: https://www.waterqualitydata.us/data/Result/search?siteid=USGS-01491000&count=no&characteristicName=Orthophosphate&mimeType=csv
#> NEWS: Data does not include USGS data newer than March 11, 2024. More details:
#> https://doi-usgs.github.io/dataRetrieval/articles/Status.html
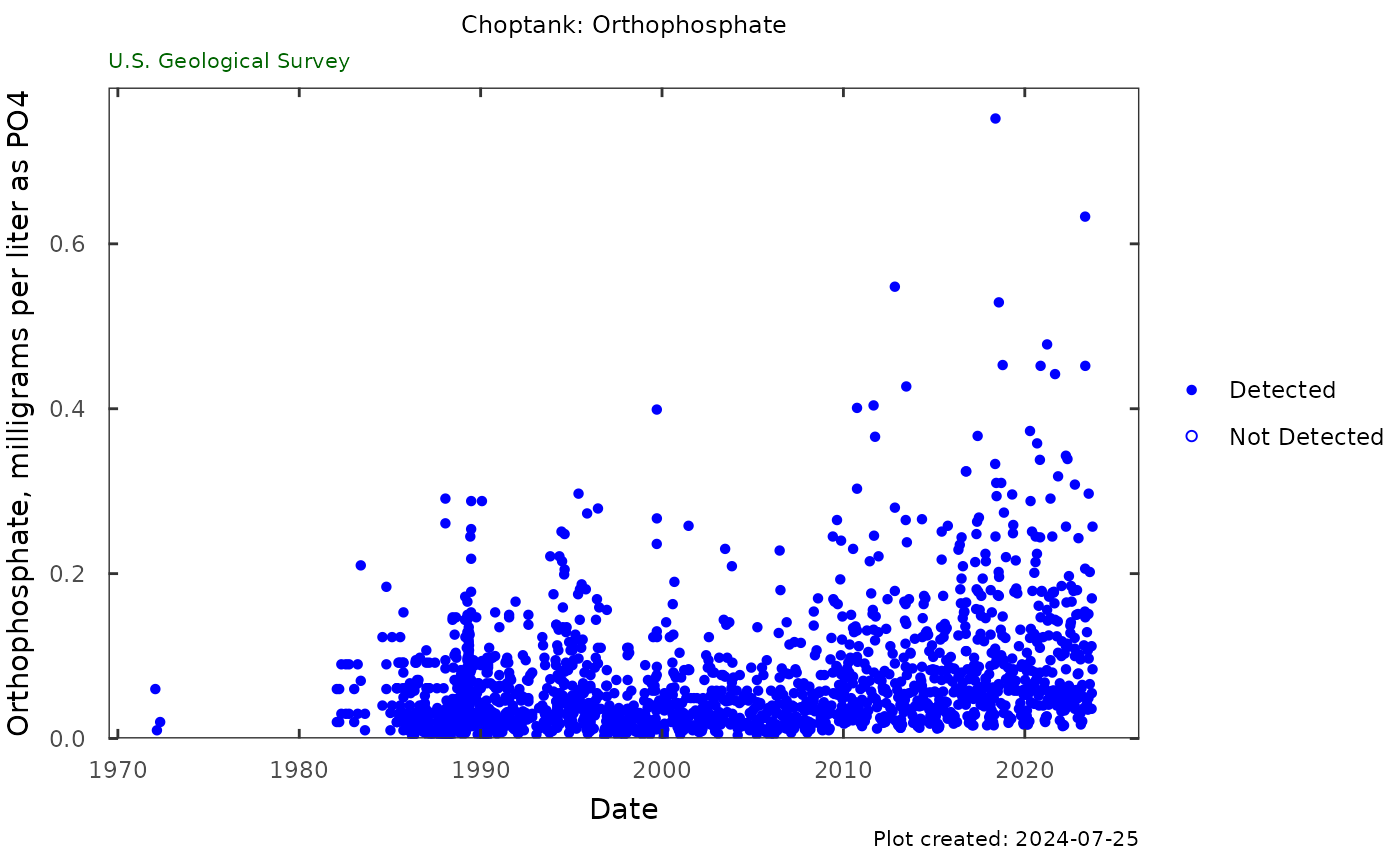
qw_plot(qw_data_phos ,
CharacteristicName = "Orthophosphate",
plot_title = "Choptank: Orthophosphate")
#> Warning: Removed 50 rows containing missing values or values outside the scale range
#> (`geom_point()`).
site <- "USGS-01491000"
qw_data_phos <- dataRetrieval::readWQPqw(site, "Orthophosphate")
#> GET: https://www.waterqualitydata.us/data/Result/search?siteid=USGS-01491000&count=no&characteristicName=Orthophosphate&mimeType=csv
#> NEWS: Data does not include USGS data newer than March 11, 2024. More details:
#> https://doi-usgs.github.io/dataRetrieval/articles/Status.html
qw_plot(qw_data_phos ,
CharacteristicName = "Orthophosphate",
plot_title = "Choptank: Orthophosphate")
#> Warning: Removed 50 rows containing missing values or values outside the scale range
#> (`geom_point()`).
 qw_summary(qw_data, CharacteristicName = "Chloride",
norm_range = c(230, 860))
#> Analysis Result
#> 1 Date of first sample 1978-09-06
#> 2 First sample result (mg/l) 52
#> 3 Date of last sample 2022-05-18
#> 4 Last sample result (mg/l) 72
#> 5 Date of first sample within 230 to 860 mg/l
#> 6 Date of first sample with 861 mg/l or greater
#> 7 Minimum (mg/l) 14
#> 8 Maximum (mg/l) 119
#> 9 Mean (mg/l) 60.9
#> 10 First quartile (mg/l) 54
#> 11 Median (mg/l) 58
#> 12 Third quartile (mg/l) 68
#> 13 Number of samples 81
qw_summary(qw_data, CharacteristicName = "Specific conductance",
norm_range = NA)
#> Analysis Result
#> 1 Date of first sample 1979-05-09
#> 2 First sample result (uS/cm @25C) 580
#> 3 Date of last sample 2022-05-18
#> 4 Last sample result (uS/cm @25C) 606
#> 5 Minimum (uS/cm @25C) 176
#> 6 Maximum (uS/cm @25C) 785
#> 7 Mean (uS/cm @25C) 553
#> 8 First quartile (uS/cm @25C) 544
#> 9 Median (uS/cm @25C) 560
#> 10 Third quartile (uS/cm @25C) 569
#> 11 Number of samples 394
qw_summary(qw_data, CharacteristicName = "Chloride",
norm_range = c(230, 860))
#> Analysis Result
#> 1 Date of first sample 1978-09-06
#> 2 First sample result (mg/l) 52
#> 3 Date of last sample 2022-05-18
#> 4 Last sample result (mg/l) 72
#> 5 Date of first sample within 230 to 860 mg/l
#> 6 Date of first sample with 861 mg/l or greater
#> 7 Minimum (mg/l) 14
#> 8 Maximum (mg/l) 119
#> 9 Mean (mg/l) 60.9
#> 10 First quartile (mg/l) 54
#> 11 Median (mg/l) 58
#> 12 Third quartile (mg/l) 68
#> 13 Number of samples 81
qw_summary(qw_data, CharacteristicName = "Specific conductance",
norm_range = NA)
#> Analysis Result
#> 1 Date of first sample 1979-05-09
#> 2 First sample result (uS/cm @25C) 580
#> 3 Date of last sample 2022-05-18
#> 4 Last sample result (uS/cm @25C) 606
#> 5 Minimum (uS/cm @25C) 176
#> 6 Maximum (uS/cm @25C) 785
#> 7 Mean (uS/cm @25C) 553
#> 8 First quartile (uS/cm @25C) 544
#> 9 Median (uS/cm @25C) 560
#> 10 Third quartile (uS/cm @25C) 569
#> 11 Number of samples 394