Discrete water-quality samples: get_samples
As USGS retires the legacy NWIS discrete water-quality services, the new Water Data for the Nation samples service takes their place. In Python it is exposed through three functions in dataretrieval.waterdata:
get_samples— retrieve discrete water-quality results (or, withservice=, the matching locations, activities, projects, or organizations).get_samples_summary— summarize what data a single site has.get_codes— list the allowable values for the categorical query arguments.
We’ll cover retrieving data from a known site, using geographic filters, and discovering what data are available. The interactive web UI is at https://waterdata.usgs.gov/download-samples/ and the API docs are at https://api.waterdata.usgs.gov/samples-data/docs.
Column names: unlike the OGC
get_daily/get_monitoring_locationsfunctions, the samples service uses WQX3-style names such asLocation_Latitude,Activity_StartDateTime, andResult_Measure.
[1]:
import matplotlib.pyplot as plt
import pandas as pd

from dataretrieval import waterdata
from dataretrieval.waterdata import PROFILE_LOOKUP

%matplotlib inline
plt.rcParams["figure.figsize"] = (7, 4)


def map_sites(df, title=""):
    """Static scatter plot of sample-site locations. Use folium for interactive."""
    lon = pd.to_numeric(df["Location_Longitude"], errors="coerce")
    lat = pd.to_numeric(df["Location_Latitude"], errors="coerce")
    fig, ax = plt.subplots(figsize=(7, 5))
    ax.scatter(lon, lat, s=10, color="red", alpha=0.7)
    ax.set_xlabel("Longitude")
    ax.set_ylabel("Latitude")
    ax.set_title(f"{title} ({len(df)} sites)")
    plt.show()
Retrieving data from a known site
Given a USGS site, get_samples_summary reports what discrete-sample data are available there — one row per (characteristic group, characteristic, user-supplied characteristic) with result and activity counts.
[2]:
site = "USGS-04183500"
data_at_site, _ = waterdata.get_samples_summary(monitoringLocationIdentifier=site)
data_at_site.sort_values("resultCount", ascending=False).head(10)
/tmp/ipykernel_6232/3713017147.py:2: DeprecationWarning: The 'monitoringLocationIdentifier' argument is deprecated and will be removed in a future release; use 'monitoring_location_id' instead.
  data_at_site, _ = waterdata.get_samples_summary(monitoringLocationIdentifier=site)
[2]:
| monitoringLocationIdentifier | characteristicGroup | characteristic | characteristicUserSupplied | resultCount | activityCount | firstActivity | mostRecentActivity | |
|---|---|---|---|---|---|---|---|---|
| 92 | USGS-04183500 | Physical | Stream flow, instantaneous | Discharge, instantaneous | 2512 | 1256 | 1971-10-05 | 2026-07-07 |
| 87 | USGS-04183500 | Physical | Height, gage | Gage height, above datum | 2404 | 1202 | 2013-10-23 | 2026-07-07 |
| 75 | USGS-04183500 | Nutrient | Phosphorus | Phosphorus as phosphorus, water, unfiltered | 1288 | 1288 | 1969-07-30 | 2026-05-26 |
| 69 | USGS-04183500 | Nutrient | Organic Nitrogen | Organic nitrogen as nitrogen, water, unfiltered | 1282 | 1282 | 1969-07-30 | 2026-05-26 |
| 54 | USGS-04183500 | Nutrient | Ammonia and ammonium | Total ammonia (NH4+ and NH3) as ammonium, wate... | 1226 | 1226 | 1971-10-05 | 2026-05-26 |
| 56 | USGS-04183500 | Nutrient | Ammonia and ammonium | Total ammonia (NH4+ and NH3) as nitrogen, wate... | 1226 | 1226 | 1971-10-05 | 2026-05-26 |
| 70 | USGS-04183500 | Nutrient | Orthophosphate | Orthophosphate as orthophosphate, water, filtered | 1195 | 1195 | 2013-10-23 | 2026-05-26 |
| 71 | USGS-04183500 | Nutrient | Orthophosphate | Orthophosphate as phosphorus, water, filtered | 1195 | 1195 | 2013-10-23 | 2026-05-26 |
| 58 | USGS-04183500 | Nutrient | Inorganic nitrogen (nitrate and nitrite) | Nitrate plus nitrite as nitrogen, water, filtered | 1195 | 1195 | 2013-10-23 | 2026-05-26 |
| 60 | USGS-04183500 | Nutrient | Kjeldahl nitrogen | Total ammonia (NH4+ and NH3) plus organic nitr... | 1194 | 1194 | 2013-10-23 | 2026-05-26 |
Note the characteristicUserSupplied column: asking for a bare characteristic like Phosphorus would return both filtered and unfiltered values mixed together. characteristicUserSupplied is a very specific descriptor (similar to a long-form USGS parameter code) that lets you isolate exactly the constituent you want. To pull the underlying data, use get_samples:
[3]:
user_char = "Phosphorus as phosphorus, water, unfiltered"
phos_data, _ = waterdata.get_samples(
    monitoringLocationIdentifier=site,
    characteristicUserSupplied=user_char,
)
print(f"default ('fullphyschem') profile -> {phos_data.shape[1]} columns")
/tmp/ipykernel_6232/198475073.py:2: DeprecationWarning: The 'characteristicUserSupplied' argument is deprecated and will be removed in a future release; use 'characteristic_user_supplied' instead.
  phos_data, _ = waterdata.get_samples(
/tmp/ipykernel_6232/198475073.py:2: DeprecationWarning: The 'monitoringLocationIdentifier' argument is deprecated and will be removed in a future release; use 'monitoring_location_id' instead.
  phos_data, _ = waterdata.get_samples(
default ('fullphyschem') profile -> 187 columns
The default profile (fullphyschem, the “Full physical chemical” profile) is comprehensive, hence the very wide table. For plotting we usually only need a few columns, so ask for the narrow profile instead:
[4]:
phos_narrow, _ = waterdata.get_samples(
    monitoringLocationIdentifier=site,
    characteristicUserSupplied=user_char,
    profile="narrow",
)
print(f"'narrow' profile -> {phos_narrow.shape[1]} columns")
phos_narrow[["Activity_StartDateTime", "Result_Measure", "Result_MeasureUnit"]].head()
/tmp/ipykernel_6232/784441668.py:1: DeprecationWarning: The 'characteristicUserSupplied' argument is deprecated and will be removed in a future release; use 'characteristic_user_supplied' instead.
  phos_narrow, _ = waterdata.get_samples(
/tmp/ipykernel_6232/784441668.py:1: DeprecationWarning: The 'monitoringLocationIdentifier' argument is deprecated and will be removed in a future release; use 'monitoring_location_id' instead.
  phos_narrow, _ = waterdata.get_samples(
'narrow' profile -> 65 columns
[4]:
| Activity_StartDateTime | Result_Measure | Result_MeasureUnit | |
|---|---|---|---|
| 0 | 1969-07-30 18:30:00+00:00 | 0.65 | mg/L |
| 1 | 1969-08-06 16:50:00+00:00 | 0.49 | mg/L |
| 2 | 1969-08-20 15:15:00+00:00 | 1.80 | mg/L |
| 3 | 1969-09-03 17:37:00+00:00 | 2.30 | mg/L |
| 4 | 1969-09-18 16:40:00+00:00 | 2.40 | mg/L |
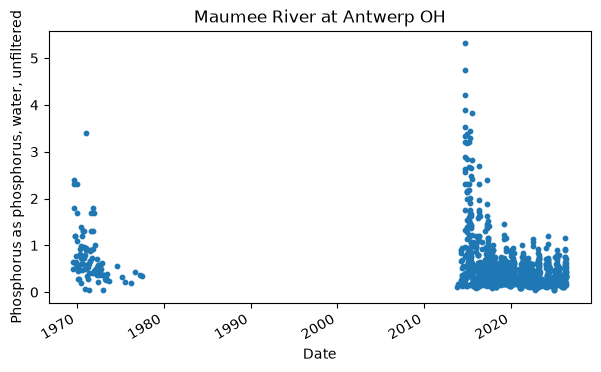
[5]:
x = pd.to_datetime(phos_narrow["Activity_StartDateTime"], errors="coerce")
y = pd.to_numeric(phos_narrow["Result_Measure"], errors="coerce")
fig, ax = plt.subplots(figsize=(7, 4))
ax.scatter(x, y, s=10)
ax.set_xlabel("Date")
ax.set_ylabel(user_char, wrap=True)
ax.set_title(phos_narrow["Location_Name"].iloc[0])
fig.autofmt_xdate()
plt.show()
Return data types
Two arguments control what comes back: service defines the kind of data and profile defines which columns of that kind are returned. The valid combinations are published in PROFILE_LOOKUP:
[6]:
PROFILE_LOOKUP
[6]:
{'activities': ['sampact', 'actmetric', 'actgroup', 'count'],
 'locations': ['site', 'count'],
 'organizations': ['organization', 'count'],
 'projects': ['project', 'projectmonitoringlocationweight'],
 'results': ['fullphyschem',
  'basicphyschem',
  'fullbio',
  'basicbio',
  'narrow',
  'resultdetectionquantitationlimit',
  'labsampleprep',
  'count']}
Geographic filters
Often you don’t know a site number but you do have an area of interest. Below we keep the queries lightweight by setting service="locations" and profile="site" (so we get where data exists, not the result values themselves) and filter on our phosphorus characteristic.
Bounding box
A bounding box is [west, south, east, north] (longitudes then latitudes):
[7]:
bbox = [-90.8, 44.2, -89.9, 45.0]
bbox_sites, _ = waterdata.get_samples(
    boundingBox=bbox,
    characteristicUserSupplied=user_char,
    service="locations",
    profile="site",
)
map_sites(bbox_sites, "Phosphorus sites in bounding box")
/tmp/ipykernel_6232/4134191907.py:2: DeprecationWarning: The 'characteristicUserSupplied' argument is deprecated and will be removed in a future release; use 'characteristic_user_supplied' instead.
  bbox_sites, _ = waterdata.get_samples(
/tmp/ipykernel_6232/4134191907.py:2: DeprecationWarning: The 'boundingBox' argument is deprecated and will be removed in a future release; use 'bbox' instead.
  bbox_sites, _ = waterdata.get_samples(
---------------------------------------------------------------------------
ReadTimeout                               Traceback (most recent call last)
File /opt/hostedtoolcache/Python/3.13.14/x64/lib/python3.13/site-packages/httpx/_transports/default.py:101, in map_httpcore_exceptions()
    100 try:
--> 101     yield
    102 except Exception as exc:

File /opt/hostedtoolcache/Python/3.13.14/x64/lib/python3.13/site-packages/httpx/_transports/default.py:250, in HTTPTransport.handle_request(self, request)
    249 with map_httpcore_exceptions():
--> 250     resp = self._pool.handle_request(req)
    252 assert isinstance(resp.stream, typing.Iterable)

File /opt/hostedtoolcache/Python/3.13.14/x64/lib/python3.13/site-packages/httpcore/_sync/connection_pool.py:256, in ConnectionPool.handle_request(self, request)
    255     self._close_connections(closing)
--> 256     raise exc from None
    258 # Return the response. Note that in this case we still have to manage
    259 # the point at which the response is closed.

File /opt/hostedtoolcache/Python/3.13.14/x64/lib/python3.13/site-packages/httpcore/_sync/connection_pool.py:236, in ConnectionPool.handle_request(self, request)
    234 try:
    235     # Send the request on the assigned connection.
--> 236     response = connection.handle_request(
    237         pool_request.request
    238     )
    239 except ConnectionNotAvailable:
    240     # In some cases a connection may initially be available to
    241     # handle a request, but then become unavailable.
    242     #
    243     # In this case we clear the connection and try again.

File /opt/hostedtoolcache/Python/3.13.14/x64/lib/python3.13/site-packages/httpcore/_sync/connection.py:103, in HTTPConnection.handle_request(self, request)
    101     raise exc
--> 103 return self._connection.handle_request(request)

File /opt/hostedtoolcache/Python/3.13.14/x64/lib/python3.13/site-packages/httpcore/_sync/http11.py:136, in HTTP11Connection.handle_request(self, request)
    135         self._response_closed()
--> 136 raise exc

File /opt/hostedtoolcache/Python/3.13.14/x64/lib/python3.13/site-packages/httpcore/_sync/http11.py:106, in HTTP11Connection.handle_request(self, request)
     97 with Trace(
     98     "receive_response_headers", logger, request, kwargs
     99 ) as trace:
    100     (
    101         http_version,
    102         status,
    103         reason_phrase,
    104         headers,
    105         trailing_data,
--> 106     ) = self._receive_response_headers(**kwargs)
    107     trace.return_value = (
    108         http_version,
    109         status,
    110         reason_phrase,
    111         headers,
    112     )

File /opt/hostedtoolcache/Python/3.13.14/x64/lib/python3.13/site-packages/httpcore/_sync/http11.py:177, in HTTP11Connection._receive_response_headers(self, request)
    176 while True:
--> 177     event = self._receive_event(timeout=timeout)
    178     if isinstance(event, h11.Response):

File /opt/hostedtoolcache/Python/3.13.14/x64/lib/python3.13/site-packages/httpcore/_sync/http11.py:217, in HTTP11Connection._receive_event(self, timeout)
    216 if event is h11.NEED_DATA:
--> 217     data = self._network_stream.read(
    218         self.READ_NUM_BYTES, timeout=timeout
    219     )
    221     # If we feed this case through h11 we'll raise an exception like:
    222     #
    223     #     httpcore.RemoteProtocolError: can't handle event type
   (...)    227     # perspective. Instead we handle this case distinctly and treat
    228     # it as a ConnectError.

File /opt/hostedtoolcache/Python/3.13.14/x64/lib/python3.13/site-packages/httpcore/_backends/sync.py:126, in SyncStream.read(self, max_bytes, timeout)
    125 exc_map: ExceptionMapping = {socket.timeout: ReadTimeout, OSError: ReadError}
--> 126 with map_exceptions(exc_map):
    127     self._sock.settimeout(timeout)

File /opt/hostedtoolcache/Python/3.13.14/x64/lib/python3.13/contextlib.py:162, in _GeneratorContextManager.__exit__(self, typ, value, traceback)
    161 try:
--> 162     self.gen.throw(value)
    163 except StopIteration as exc:
    164     # Suppress StopIteration *unless* it's the same exception that
    165     # was passed to throw().  This prevents a StopIteration
    166     # raised inside the "with" statement from being suppressed.

File /opt/hostedtoolcache/Python/3.13.14/x64/lib/python3.13/site-packages/httpcore/_exceptions.py:14, in map_exceptions(map)
     13     if isinstance(exc, from_exc):
---> 14         raise to_exc(exc) from exc
     15 raise

ReadTimeout: The read operation timed out

The above exception was the direct cause of the following exception:

ReadTimeout                               Traceback (most recent call last)
File /opt/hostedtoolcache/Python/3.13.14/x64/lib/python3.13/site-packages/dataretrieval/utils.py:398, in _get(url, **kwargs)
    397 try:
--> 398     return httpx.get(url, **kwargs)
    399 except httpx.TransportError as exc:

File /opt/hostedtoolcache/Python/3.13.14/x64/lib/python3.13/site-packages/httpx/_api.py:195, in get(url, params, headers, cookies, auth, proxy, follow_redirects, verify, timeout, trust_env)
    187 """
    188 Sends a `GET` request.
    189
   (...)    193 on this function, as `GET` requests should not include a request body.
    194 """
--> 195 return request(
    196     "GET",
    197     url,
    198     params=params,
    199     headers=headers,
    200     cookies=cookies,
    201     auth=auth,
    202     proxy=proxy,
    203     follow_redirects=follow_redirects,
    204     verify=verify,
    205     timeout=timeout,
    206     trust_env=trust_env,
    207 )

File /opt/hostedtoolcache/Python/3.13.14/x64/lib/python3.13/site-packages/httpx/_api.py:109, in request(method, url, params, content, data, files, json, headers, cookies, auth, proxy, timeout, follow_redirects, verify, trust_env)
    102 with Client(
    103     cookies=cookies,
    104     proxy=proxy,
   (...)    107     trust_env=trust_env,
    108 ) as client:
--> 109     return client.request(
    110         method=method,
    111         url=url,
    112         content=content,
    113         data=data,
    114         files=files,
    115         json=json,
    116         params=params,
    117         headers=headers,
    118         auth=auth,
    119         follow_redirects=follow_redirects,
    120     )

File /opt/hostedtoolcache/Python/3.13.14/x64/lib/python3.13/site-packages/httpx/_client.py:825, in Client.request(self, method, url, content, data, files, json, params, headers, cookies, auth, follow_redirects, timeout, extensions)
    812 request = self.build_request(
    813     method=method,
    814     url=url,
   (...)    823     extensions=extensions,
    824 )
--> 825 return self.send(request, auth=auth, follow_redirects=follow_redirects)

File /opt/hostedtoolcache/Python/3.13.14/x64/lib/python3.13/site-packages/httpx/_client.py:914, in Client.send(self, request, stream, auth, follow_redirects)
    912 auth = self._build_request_auth(request, auth)
--> 914 response = self._send_handling_auth(
    915     request,
    916     auth=auth,
    917     follow_redirects=follow_redirects,
    918     history=[],
    919 )
    920 try:

File /opt/hostedtoolcache/Python/3.13.14/x64/lib/python3.13/site-packages/httpx/_client.py:942, in Client._send_handling_auth(self, request, auth, follow_redirects, history)
    941 while True:
--> 942     response = self._send_handling_redirects(
    943         request,
    944         follow_redirects=follow_redirects,
    945         history=history,
    946     )
    947     try:

File /opt/hostedtoolcache/Python/3.13.14/x64/lib/python3.13/site-packages/httpx/_client.py:979, in Client._send_handling_redirects(self, request, follow_redirects, history)
    977     hook(request)
--> 979 response = self._send_single_request(request)
    980 try:

File /opt/hostedtoolcache/Python/3.13.14/x64/lib/python3.13/site-packages/httpx/_client.py:1014, in Client._send_single_request(self, request)
   1013 with request_context(request=request):
-> 1014     response = transport.handle_request(request)
   1016 assert isinstance(response.stream, SyncByteStream)

File /opt/hostedtoolcache/Python/3.13.14/x64/lib/python3.13/site-packages/httpx/_transports/default.py:249, in HTTPTransport.handle_request(self, request)
    237 req = httpcore.Request(
    238     method=request.method,
    239     url=httpcore.URL(
   (...)    247     extensions=request.extensions,
    248 )
--> 249 with map_httpcore_exceptions():
    250     resp = self._pool.handle_request(req)

File /opt/hostedtoolcache/Python/3.13.14/x64/lib/python3.13/contextlib.py:162, in _GeneratorContextManager.__exit__(self, typ, value, traceback)
    161 try:
--> 162     self.gen.throw(value)
    163 except StopIteration as exc:
    164     # Suppress StopIteration *unless* it's the same exception that
    165     # was passed to throw().  This prevents a StopIteration
    166     # raised inside the "with" statement from being suppressed.

File /opt/hostedtoolcache/Python/3.13.14/x64/lib/python3.13/site-packages/httpx/_transports/default.py:118, in map_httpcore_exceptions()
    117 message = str(exc)
--> 118 raise mapped_exc(message) from exc

ReadTimeout: The read operation timed out

The above exception was the direct cause of the following exception:

NetworkError                              Traceback (most recent call last)
Cell In[7], line 2
      1 bbox = [-90.8, 44.2, -89.9, 45.0]
----> 2 bbox_sites, _ = waterdata.get_samples(
      3     boundingBox=bbox,
      4     characteristicUserSupplied=user_char,
      5     service="locations",

File /opt/hostedtoolcache/Python/3.13.14/x64/lib/python3.13/site-packages/dataretrieval/waterdata/utils.py:368, in _accept_legacy_kwargs.<locals>.decorator.<locals>.wrapper(*args, **kwargs)
    361     warnings.warn(
    362         f"The {old_name!r} argument is deprecated and will be "
    363         f"removed in a future release; use {new_name!r} instead.",
    364         DeprecationWarning,
    365         stacklevel=2,
    366     )
    367     kwargs[new_name] = kwargs.pop(old_name)
--> 368 return func(*args, **kwargs)

File /opt/hostedtoolcache/Python/3.13.14/x64/lib/python3.13/site-packages/dataretrieval/waterdata/api.py:2733, in get_samples(ssl_check, service, profile, activity_media_name, activity_start_date_lower, activity_start_date_upper, activity_type_code, characteristic_group, characteristic, characteristic_user_supplied, bbox, country_code, state_code, county_code, site_type_code, site_type_name, usgs_pcode, hydrologic_unit, monitoring_location_id, organization_id, point_location_latitude, point_location_longitude, point_location_within_miles, project_id, record_identifier_user_supplied)
   2729     params["boundingBox"] = to_str(params["boundingBox"])
   2731 url = f"{SAMPLES_URL}/{service}/{profile}"
-> 2733 df, response = _get_samples_csv(url, params, ssl_check)
   2734 df = _attach_datetime_columns(df)
   2736 return df, BaseMetadata(response)

File /opt/hostedtoolcache/Python/3.13.14/x64/lib/python3.13/site-packages/dataretrieval/waterdata/api.py:2460, in _get_samples_csv(url, params, ssl_check)
   2451 """Issue a Samples CSV request and parse the body into a DataFrame.
   2452
   2453 Shared tail for the Samples getters: sends the GET with the standard
   (...)   2457 as metadata and applies any per-getter post-step.
   2458 """
   2459 logger.debug("Request: %s", httpx.URL(url).copy_merge_params(params))
-> 2460 response = _get(
   2461     url,
   2462     params=params,
   2463     verify=ssl_check,
   2464     headers=_default_headers(),
   2465     **HTTPX_DEFAULTS,
   2466 )
   2467 _raise_for_non_200(response)
   2468 df = pd.read_csv(StringIO(response.text), delimiter=",")

File /opt/hostedtoolcache/Python/3.13.14/x64/lib/python3.13/site-packages/dataretrieval/utils.py:400, in _get(url, **kwargs)
    398     return httpx.get(url, **kwargs)
    399 except httpx.TransportError as exc:
--> 400     raise _network_error(url, exc) from exc

NetworkError: Could not reach the service at https://api.waterdata.usgs.gov/samples-data/locations/site: The read operation timed out
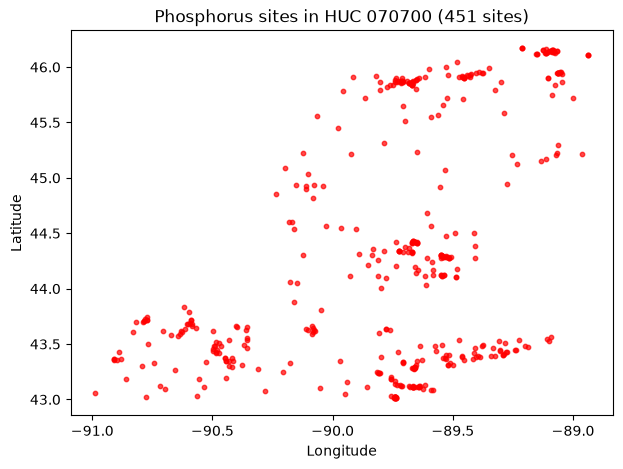
Hydrologic unit codes (HUCs)
HUCs identify drainage areas; this filter accepts 2-, 4-, 6-, 8-, 10-, or 12-digit codes.
[8]:
huc_sites, _ = waterdata.get_samples(
    hydrologicUnit="070700",
    characteristicUserSupplied=user_char,
    service="locations",
    profile="site",
)
map_sites(huc_sites, "Phosphorus sites in HUC 070700")
/tmp/ipykernel_6232/3301780226.py:1: DeprecationWarning: The 'characteristicUserSupplied' argument is deprecated and will be removed in a future release; use 'characteristic_user_supplied' instead.
  huc_sites, _ = waterdata.get_samples(
/tmp/ipykernel_6232/3301780226.py:1: DeprecationWarning: The 'hydrologicUnit' argument is deprecated and will be removed in a future release; use 'hydrologic_unit' instead.
  huc_sites, _ = waterdata.get_samples(
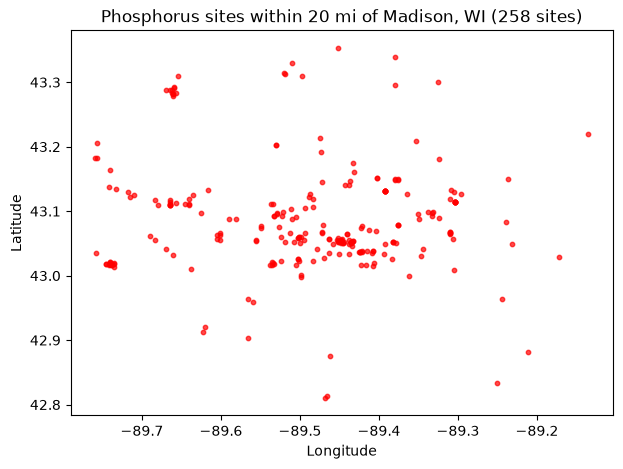
Distance from a point
Supply a latitude, longitude, and radius in miles:
[9]:
point_sites, _ = waterdata.get_samples(
    pointLocationLatitude=43.074680,
    pointLocationLongitude=-89.428054,
    pointLocationWithinMiles=20,
    characteristicUserSupplied=user_char,
    service="locations",
    profile="site",
)
map_sites(point_sites, "Phosphorus sites within 20 mi of Madison, WI")
/tmp/ipykernel_6232/937496630.py:1: DeprecationWarning: The 'characteristicUserSupplied' argument is deprecated and will be removed in a future release; use 'characteristic_user_supplied' instead.
  point_sites, _ = waterdata.get_samples(
/tmp/ipykernel_6232/937496630.py:1: DeprecationWarning: The 'pointLocationLatitude' argument is deprecated and will be removed in a future release; use 'point_location_latitude' instead.
  point_sites, _ = waterdata.get_samples(
/tmp/ipykernel_6232/937496630.py:1: DeprecationWarning: The 'pointLocationLongitude' argument is deprecated and will be removed in a future release; use 'point_location_longitude' instead.
  point_sites, _ = waterdata.get_samples(
/tmp/ipykernel_6232/937496630.py:1: DeprecationWarning: The 'pointLocationWithinMiles' argument is deprecated and will be removed in a future release; use 'point_location_within_miles' instead.
  point_sites, _ = waterdata.get_samples(
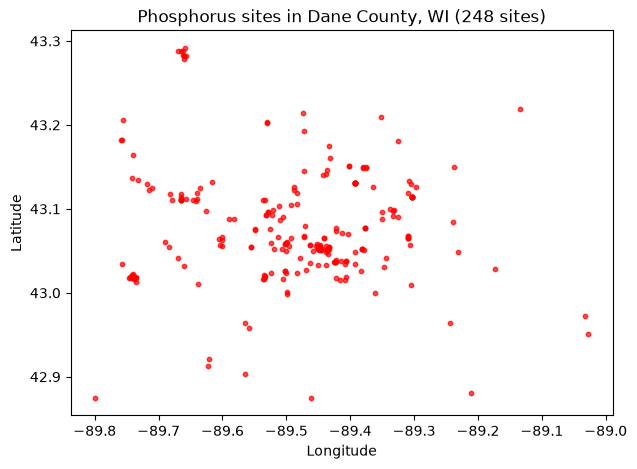
County FIPS
County FIPS codes take the form US:SS:CCC. Wisconsin’s state code is available from dataretrieval.codes, and Dane County’s full FIPS is US:55:025.
[10]:
from dataretrieval.codes import states

wi = states.fips_codes["Wisconsin"]  # "55"
dane_county = f"US:{wi}:025"
county_sites, _ = waterdata.get_samples(
    countyFips=dane_county,
    characteristicUserSupplied=user_char,
    service="locations",
    profile="site",
)
map_sites(county_sites, "Phosphorus sites in Dane County, WI")
/tmp/ipykernel_6232/1942246246.py:5: DeprecationWarning: The 'characteristicUserSupplied' argument is deprecated and will be removed in a future release; use 'characteristic_user_supplied' instead.
  county_sites, _ = waterdata.get_samples(
/tmp/ipykernel_6232/1942246246.py:5: DeprecationWarning: The 'countyFips' argument is deprecated and will be removed in a future release; use 'county_code' instead.
  county_sites, _ = waterdata.get_samples(
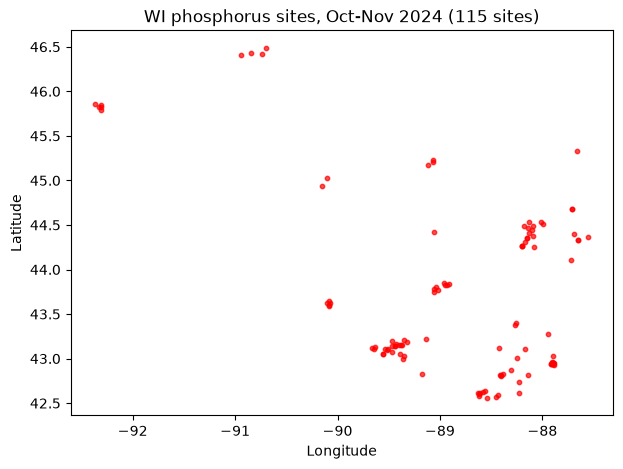
State FIPS
State FIPS codes take the form US:SS. A whole-state query can return a lot of sites, so here we also constrain the activity start date to October–November 2024 (see Additional query parameters below):
[11]:
state_fip = f"US:{wi}"  # "US:55"
state_sites_recent, _ = waterdata.get_samples(
    stateFips=state_fip,
    characteristicUserSupplied=user_char,
    service="locations",
    activityStartDateLower="2024-10-01",
    activityStartDateUpper="2024-11-30",
    profile="site",
)
map_sites(state_sites_recent, "WI phosphorus sites, Oct-Nov 2024")
/tmp/ipykernel_6232/2071568402.py:2: DeprecationWarning: The 'activityStartDateLower' argument is deprecated and will be removed in a future release; use 'activity_start_date_lower' instead.
  state_sites_recent, _ = waterdata.get_samples(
/tmp/ipykernel_6232/2071568402.py:2: DeprecationWarning: The 'activityStartDateUpper' argument is deprecated and will be removed in a future release; use 'activity_start_date_upper' instead.
  state_sites_recent, _ = waterdata.get_samples(
/tmp/ipykernel_6232/2071568402.py:2: DeprecationWarning: The 'characteristicUserSupplied' argument is deprecated and will be removed in a future release; use 'characteristic_user_supplied' instead.
  state_sites_recent, _ = waterdata.get_samples(
/tmp/ipykernel_6232/2071568402.py:2: DeprecationWarning: The 'stateFips' argument is deprecated and will be removed in a future release; use 'state_code' instead.
  state_sites_recent, _ = waterdata.get_samples(
Additional query parameters
Several parameters narrow the results further. The allowable values for the categorical ones come from get_codes, which — like the other waterdata functions — returns a (DataFrame, metadata) tuple; we unpack it and keep the DataFrame.
siteTypeCode / siteTypeName
[12]:
site_type_info, _ = waterdata.get_codes(code_service="sitetype")
site_type_info[["typeCode", "typeLongName"]].head(10)
[12]:
| typeCode | typeLongName | |
|---|---|---|
| 0 | GL | Glacier |
| 1 | WE | Wetland |
| 2 | LA | Land |
| 3 | LA-EX | Excavation |
| 4 | LA-OU | Outcrop |
| 5 | LA-PLY | Playa |
| 6 | LA-SNK | Sinkhole |
| 7 | LA-SH | Soil hole |
| 8 | LA-SR | Shore |
| 9 | LA-VOL | Volcanic vent |
activityMediaName
The environmental medium that was sampled or analyzed:
[13]:
media, _ = waterdata.get_codes(code_service="samplemedia")
media["activityMedia"].tolist()
[13]:
['Air', 'Biological tissue', 'Other', 'Sediment', 'Soil', 'Water', nan]
characteristicGroup
A broad category describing the measurement (generally following the Water Quality Portal groups):
[14]:
char_groups, _ = waterdata.get_codes(code_service="characteristicgroup")
char_groups["characteristicGroup"].tolist()
[14]:
['Biological',
 'Information',
 'Inorganics, Major, Metals',
 'Inorganics, Major, Non-metals',
 'Inorganics, Minor, Metals',
 'Inorganics, Minor, Non-metals',
 'Microbiological',
 'Nutrient',
 'Organics, Other',
 'Organics, PCBs',
 'Organics, Pesticide',
 'Organics, PFAS',
 'Physical',
 'Population/Community',
 'Radiochemical',
 'Sediment',
 'Stable Isotopes',
 'Toxicity']
characteristic and usgsPCode
The characteristics table lists specific constituents along with their USGS parameter codes:
[15]:
characteristic_info, _ = waterdata.get_codes(code_service="characteristics")
print("unique characteristic names:")
print(characteristic_info["characteristicName"].drop_duplicates().head().tolist())
print("\nexample USGS parameter codes:")
print(characteristic_info["parameterCode"].dropna().drop_duplicates().head().tolist())
unique characteristic names:
['Hydroxy-amitriptyline, 10-', '1,1,1,2-Tetrachloroethane', '1,1,1-Trichloro-2-propanone', '1,1,1-Trichloroethane', '1,1,2,2-Tetrachloroethane']

example USGS parameter codes:
['67995', '52417', '30089', '62235', '77562']
characteristicUserSupplied
The USGS “observed property” — the detailed descriptor that replaces the old parameter name / pcode for discrete data, and the value we filtered on above:
[16]:
observed, _ = waterdata.get_codes(code_service="observedproperty")
observed["observedProperty"].head().tolist()
[16]:
['10-Hydroxy-amitriptyline, water, filtered, recoverable',
 '1,1,1,2-Tetrachloroethane, bed sediment (dry mass basis), recoverable',
 '1,1,1,2-Tetrachloroethane, soil (dry mass basis), recoverable',
 '1,1,1,2-Tetrachloroethane, water, unfiltered, recoverable',
 '1,1,1-Trichloro-2-propanone, water, filtered, recoverable']
Other filters worth knowing about: projectIdentifier (needs prior project info), recordIdentifierUserSupplied (needs the supplier’s record id), and activityStartDateLower / activityStartDateUpper for date ranges (used above).
Data discovery
Combining a geographic filter with site-type and characteristic filters lets you zero in on candidate sites. For example, lakes in Dane County, WI that measured our phosphorus characteristic:
[17]:
county_lake_sites, _ = waterdata.get_samples(
    countyFips=dane_county,
    characteristicUserSupplied=user_char,
    siteTypeName="Lake, Reservoir, Impoundment",
    service="locations",
    profile="site",
)
print(f"{len(county_lake_sites)} lake sites measuring phosphorus in Dane County, WI")
/tmp/ipykernel_6232/3513897362.py:1: DeprecationWarning: The 'characteristicUserSupplied' argument is deprecated and will be removed in a future release; use 'characteristic_user_supplied' instead.
  county_lake_sites, _ = waterdata.get_samples(
/tmp/ipykernel_6232/3513897362.py:1: DeprecationWarning: The 'countyFips' argument is deprecated and will be removed in a future release; use 'county_code' instead.
  county_lake_sites, _ = waterdata.get_samples(
/tmp/ipykernel_6232/3513897362.py:1: DeprecationWarning: The 'siteTypeName' argument is deprecated and will be removed in a future release; use 'site_type_name' instead.
  county_lake_sites, _ = waterdata.get_samples(
18 lake sites measuring phosphorus in Dane County, WI
get_samples_summary accepts one site at a time, so we loop over the candidate sites to tally how much phosphorus data each has — useful for deciding which sites to actually pull results from.
[18]:
rows = []
for loc_id in county_lake_sites["Location_Identifier"]:
    avail, _ = waterdata.get_samples_summary(monitoringLocationIdentifier=loc_id)
    rows.append(avail[avail["characteristicUserSupplied"] == user_char])

all_data = pd.concat(rows, ignore_index=True)
all_data.sort_values("resultCount", ascending=False)[
    [
        "monitoringLocationIdentifier",
        "resultCount",
        "activityCount",
        "firstActivity",
        "mostRecentActivity",
    ]
]
/tmp/ipykernel_6232/2100374856.py:3: DeprecationWarning: The 'monitoringLocationIdentifier' argument is deprecated and will be removed in a future release; use 'monitoring_location_id' instead.
  avail, _ = waterdata.get_samples_summary(monitoringLocationIdentifier=loc_id)
/tmp/ipykernel_6232/2100374856.py:3: DeprecationWarning: The 'monitoringLocationIdentifier' argument is deprecated and will be removed in a future release; use 'monitoring_location_id' instead.
  avail, _ = waterdata.get_samples_summary(monitoringLocationIdentifier=loc_id)
/tmp/ipykernel_6232/2100374856.py:3: DeprecationWarning: The 'monitoringLocationIdentifier' argument is deprecated and will be removed in a future release; use 'monitoring_location_id' instead.
  avail, _ = waterdata.get_samples_summary(monitoringLocationIdentifier=loc_id)
/tmp/ipykernel_6232/2100374856.py:3: DeprecationWarning: The 'monitoringLocationIdentifier' argument is deprecated and will be removed in a future release; use 'monitoring_location_id' instead.
  avail, _ = waterdata.get_samples_summary(monitoringLocationIdentifier=loc_id)
/tmp/ipykernel_6232/2100374856.py:3: DeprecationWarning: The 'monitoringLocationIdentifier' argument is deprecated and will be removed in a future release; use 'monitoring_location_id' instead.
  avail, _ = waterdata.get_samples_summary(monitoringLocationIdentifier=loc_id)
/tmp/ipykernel_6232/2100374856.py:3: DeprecationWarning: The 'monitoringLocationIdentifier' argument is deprecated and will be removed in a future release; use 'monitoring_location_id' instead.
  avail, _ = waterdata.get_samples_summary(monitoringLocationIdentifier=loc_id)
/tmp/ipykernel_6232/2100374856.py:3: DeprecationWarning: The 'monitoringLocationIdentifier' argument is deprecated and will be removed in a future release; use 'monitoring_location_id' instead.
  avail, _ = waterdata.get_samples_summary(monitoringLocationIdentifier=loc_id)
/tmp/ipykernel_6232/2100374856.py:3: DeprecationWarning: The 'monitoringLocationIdentifier' argument is deprecated and will be removed in a future release; use 'monitoring_location_id' instead.
  avail, _ = waterdata.get_samples_summary(monitoringLocationIdentifier=loc_id)
/tmp/ipykernel_6232/2100374856.py:3: DeprecationWarning: The 'monitoringLocationIdentifier' argument is deprecated and will be removed in a future release; use 'monitoring_location_id' instead.
  avail, _ = waterdata.get_samples_summary(monitoringLocationIdentifier=loc_id)
/tmp/ipykernel_6232/2100374856.py:3: DeprecationWarning: The 'monitoringLocationIdentifier' argument is deprecated and will be removed in a future release; use 'monitoring_location_id' instead.
  avail, _ = waterdata.get_samples_summary(monitoringLocationIdentifier=loc_id)
/tmp/ipykernel_6232/2100374856.py:3: DeprecationWarning: The 'monitoringLocationIdentifier' argument is deprecated and will be removed in a future release; use 'monitoring_location_id' instead.
  avail, _ = waterdata.get_samples_summary(monitoringLocationIdentifier=loc_id)
/tmp/ipykernel_6232/2100374856.py:3: DeprecationWarning: The 'monitoringLocationIdentifier' argument is deprecated and will be removed in a future release; use 'monitoring_location_id' instead.
  avail, _ = waterdata.get_samples_summary(monitoringLocationIdentifier=loc_id)
/tmp/ipykernel_6232/2100374856.py:3: DeprecationWarning: The 'monitoringLocationIdentifier' argument is deprecated and will be removed in a future release; use 'monitoring_location_id' instead.
  avail, _ = waterdata.get_samples_summary(monitoringLocationIdentifier=loc_id)
/tmp/ipykernel_6232/2100374856.py:3: DeprecationWarning: The 'monitoringLocationIdentifier' argument is deprecated and will be removed in a future release; use 'monitoring_location_id' instead.
  avail, _ = waterdata.get_samples_summary(monitoringLocationIdentifier=loc_id)
/tmp/ipykernel_6232/2100374856.py:3: DeprecationWarning: The 'monitoringLocationIdentifier' argument is deprecated and will be removed in a future release; use 'monitoring_location_id' instead.
  avail, _ = waterdata.get_samples_summary(monitoringLocationIdentifier=loc_id)
/tmp/ipykernel_6232/2100374856.py:3: DeprecationWarning: The 'monitoringLocationIdentifier' argument is deprecated and will be removed in a future release; use 'monitoring_location_id' instead.
  avail, _ = waterdata.get_samples_summary(monitoringLocationIdentifier=loc_id)
/tmp/ipykernel_6232/2100374856.py:3: DeprecationWarning: The 'monitoringLocationIdentifier' argument is deprecated and will be removed in a future release; use 'monitoring_location_id' instead.
  avail, _ = waterdata.get_samples_summary(monitoringLocationIdentifier=loc_id)
/tmp/ipykernel_6232/2100374856.py:3: DeprecationWarning: The 'monitoringLocationIdentifier' argument is deprecated and will be removed in a future release; use 'monitoring_location_id' instead.
  avail, _ = waterdata.get_samples_summary(monitoringLocationIdentifier=loc_id)
[18]:
| monitoringLocationIdentifier | resultCount | activityCount | firstActivity | mostRecentActivity | |
|---|---|---|---|---|---|
| 13 | USGS-430309089260701 | 159 | 159 | 1986-06-28 | 1995-04-07 |
| 2 | USGS-054279449 | 96 | 96 | 1998-02-12 | 1998-08-23 |
| 10 | USGS-430117089442701 | 49 | 49 | 1992-05-21 | 1993-09-24 |
| 5 | USGS-430307089260200 | 49 | 49 | 1986-09-28 | 1988-04-05 |
| 12 | USGS-430305089260600 | 32 | 32 | 1986-11-22 | 1987-12-08 |
| 0 | USGS-05427946 | 12 | 12 | 1981-09-02 | 1982-08-12 |
| 1 | USGS-054279485 | 12 | 12 | 1981-09-02 | 1982-08-12 |
| 3 | USGS-05427949 | 12 | 12 | 1981-09-02 | 1982-08-12 |
| 9 | USGS-430113089320101 | 6 | 6 | 1975-03-22 | 1976-05-31 |
| 15 | USGS-430325089361601 | 5 | 5 | 1975-05-16 | 1976-05-19 |
| 17 | USGS-430349089361801 | 4 | 4 | 1975-05-16 | 1976-05-19 |
| 7 | USGS-430100089320601 | 1 | 1 | 1975-03-22 | 1975-03-22 |
| 6 | USGS-430059089321401 | 1 | 1 | 1975-03-22 | 1975-03-22 |
| 4 | USGS-425750089143800 | 1 | 1 | 2007-07-02 | 2007-07-02 |
| 8 | USGS-430106089315901 | 1 | 1 | 1975-03-22 | 1975-03-22 |
| 11 | USGS-430117089320701 | 1 | 1 | 1975-03-22 | 1975-03-22 |
| 14 | USGS-430321089360401 | 1 | 1 | 1975-03-22 | 1975-03-22 |
| 16 | USGS-430347089360301 | 1 | 1 | 1975-03-22 | 1975-03-22 |
This summary helps narrow down which sites to request data from — whether you need sites with recent data, lots of data, or just any measurement at all.
More help
Documentation: https://doi-usgs.github.io/dataretrieval-python/
Samples API docs: https://api.waterdata.usgs.gov/samples-data/docs
Equivalent R article: Introducing read_waterdata_samples
Issues / questions: https://github.com/DOI-USGS/dataretrieval-python/issues