This vignette shows how to work with a new service based on data from the 3D Hydrography Program (3DHP) released in 2024. 3DHP data uses “mainstem” identifiers as the primary river ID. We’ll work with one for the Baraboo River in Wisconsin.
We can find one to start with at a url like:
https://reference.geoconnex.us/collections/mainstems/items?filter=name_at_outlet ILIKE '%Baraboo%'
This url searches the reference mainstem collection for rivers with
names like “Baraboo”. Using that url query, we can find that the Baraboo
mainstem ID is https://geoconnex.us/ref/mainstems/359842
and that it flows to the Wisconsin and Mississippi
https://geoconnex.us/ref/mainstems/323742 and
https://geoconnex.us/ref/mainstems/312091 respectively. At
the reference mainstem page, we can also find that the outlet NHDPlusV2
COMID is
https://geoconnex.us/nhdplusv2/comid/937070225.
The code block just below generates starting locations based on information derived from the reference mainstem for the Baraboo and a point location near the Baraboo’s outlet. It queries the 3DHP service for a flowline within a 10m buffer of the point specified just to get us started.
  comid <- "937070225"

  point <- c(-89.441, 43.487) |>
    sf::st_point() |>
    sf::st_sfc(crs = 4326) |> sf::st_sf()

  dm <- c('https://geoconnex.us/ref/mainstems/323742',
          'https://geoconnex.us/ref/mainstems/312091')

  flowline <- get_3dhp(point, type = "flowline", buffer = 10)

  pc <- function(x) sf::st_geometry(sf::st_transform(x, 3857))

  plot_nhdplus(bbox = sf::st_bbox(sf::st_buffer(flowline, 500)), plot_config = list(flowline = list(col = NULL)), zoom = 14)
  plot(pc(flowline), add = TRUE, col = "darkblue", lwd = 2)
  plot(pc(point), pch = "O", add = TRUE)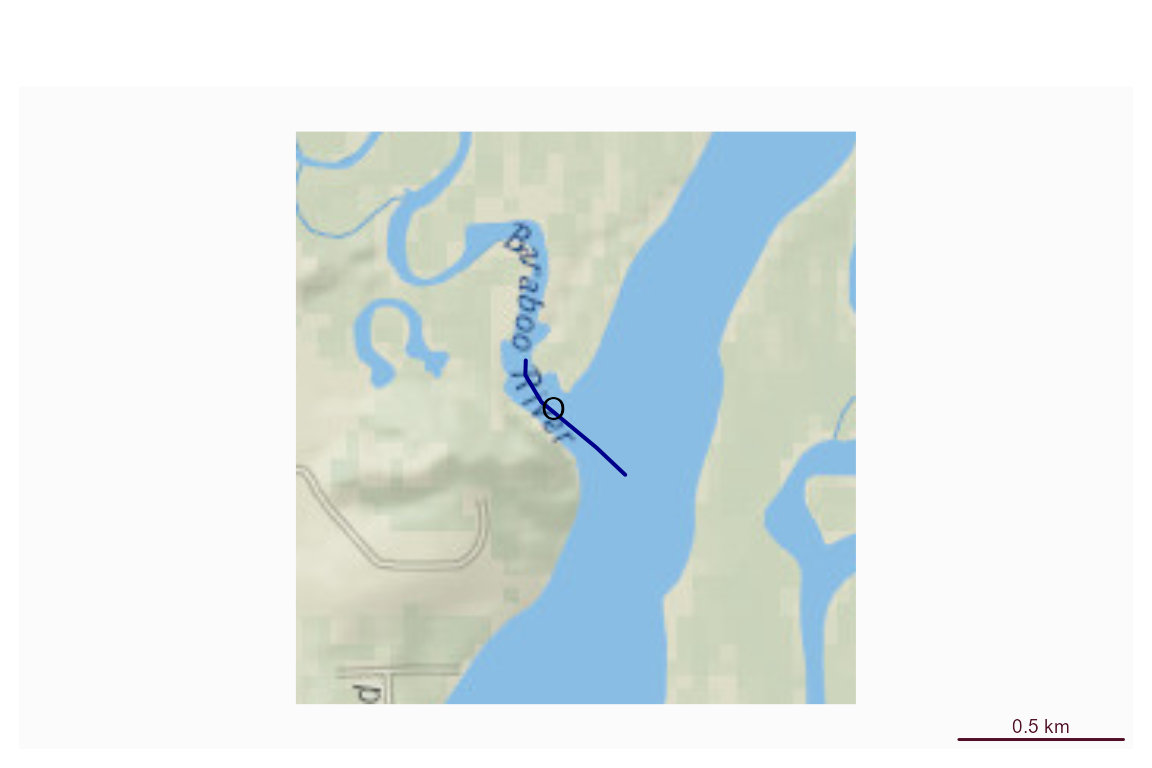
Now, we can use dataRetrieval to retrieve a basin upstream of this outlet location. We specify the NHDPlusV2 comid here since we know it, but could have used the point location just as well.
With the basin pulled from the findNLDI()
function, we can pass it to get_3dhp() as a Area of
Interest for flowlines and waterbodies. We can then use the mainstem ids
of our two downstream mainstem rivers found above to get the downtream
mainstem rivers.
  basin <- dataRetrieval::findNLDI(comid = comid, find = "basin")

  network <- get_3dhp(basin$basin, type = "flowline")
  water <- get_3dhp(basin$basin, type = "waterbody")
#> Warning: Failed to get features from https://3dhp.nationalmap.gov/arcgis/rest/services/usgs_3dhp_all/FeatureServer/60/query: HTTP 504 Gateway Timeout.
#>   <!DOCTYPE HTML PUBLIC "-//W3C//DTD HTML 4.01 Transitional//EN" "http://www.w3.org/TR/html4/loose.dtd">
#> <HTML><HEAD><META HTTP-EQUIV="Content-Type" CONTENT="text/html; charset=UTF-8">
#> <TITLE>ERROR: The request could not be satisfied</TITLE>
#> </HEAD><BODY>
#> <H1>504 Gateway Timeout ERROR</H1>
#> <H2>The request could not be satisfied.</H2>
#> <HR noshade size="1px">
#> We can't connect to the server for this app or website at this time. There might be too much traffic or a configuration error. Try again later
#> Warning: 1 of 2 feature requests failed, returned features are incomplete.

  down_mains <- get_3dhp(ids = dm, type = "flowline")
#> Warning: Failed to get features from https://3dhp.nationalmap.gov/arcgis/rest/services/usgs_3dhp_all/FeatureServer/50/query: HTTP 504 Gateway Timeout.
#>   <!DOCTYPE HTML PUBLIC "-//W3C//DTD HTML 4.01 Transitional//EN" "http://www.w3.org/TR/html4/loose.dtd">
#> <HTML><HEAD><META HTTP-EQUIV="Content-Type" CONTENT="text/html; charset=UTF-8">
#> <TITLE>ERROR: The request could not be satisfied</TITLE>
#> </HEAD><BODY>
#> <H1>504 Gateway Timeout ERROR</H1>
#> <H2>The request could not be satisfied.</H2>
#> <HR noshade size="1px">
#> We can't connect to the server for this app or website at this time. There might be too much traffic or a configuration error. Try again later
#> Warning: 1 of 2 feature requests failed, returned features are incomplete.

  old_par <- par(mar = c(0, 0, 0, 0))
  plot_nhdplus(bbox = sf::st_bbox(basin$basin), flowline_only = TRUE,
               plot_config = list(flowline = list(col = NULL)), zoom = 10)
  plot(pc(basin$basin), lwd = 2, add = TRUE)
  plot(pc(network), lwd = 0.5, add = TRUE)
  plot(pc(water), lwd = 0.5, border = "skyblue", col = "lightblue", add = TRUE)
  plot(pc(down_mains), lwd = 3, col = "blue", add = TRUE)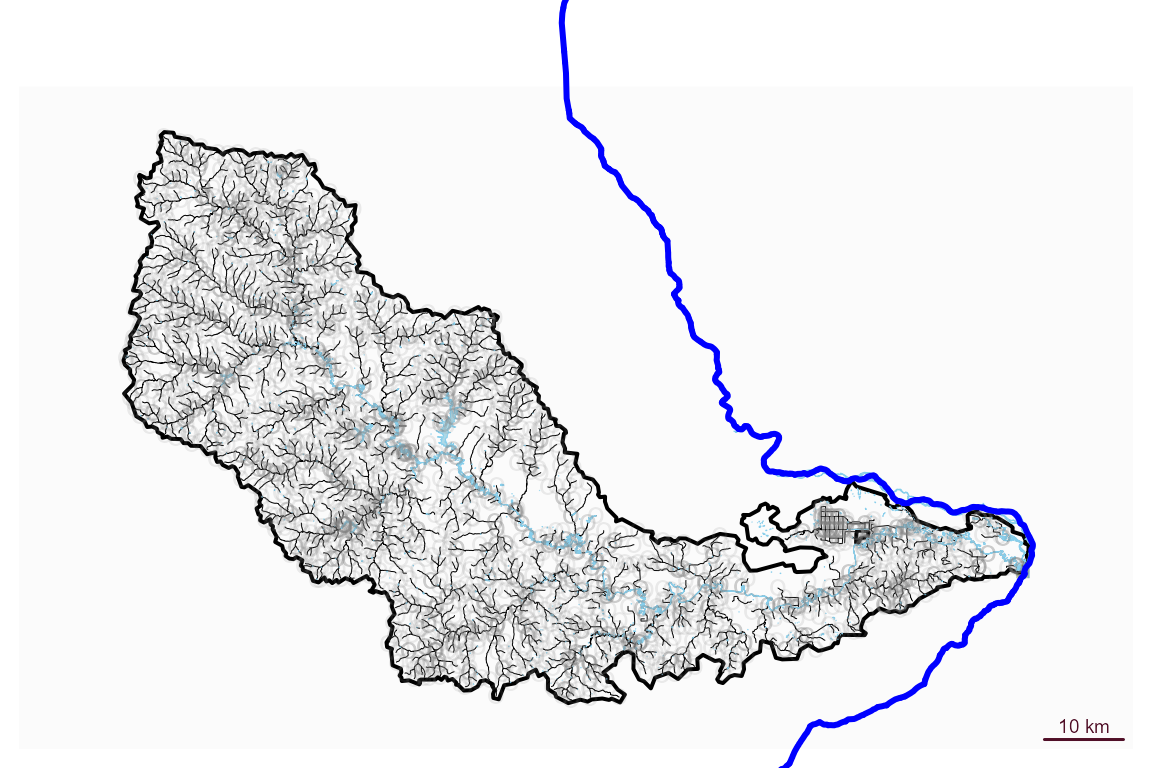
  par(old_par)

  old_par <- par(mar = c(0, 0, 0, 0))
  plot(pc(down_mains))
  plot(pc(basin$basin), add = TRUE)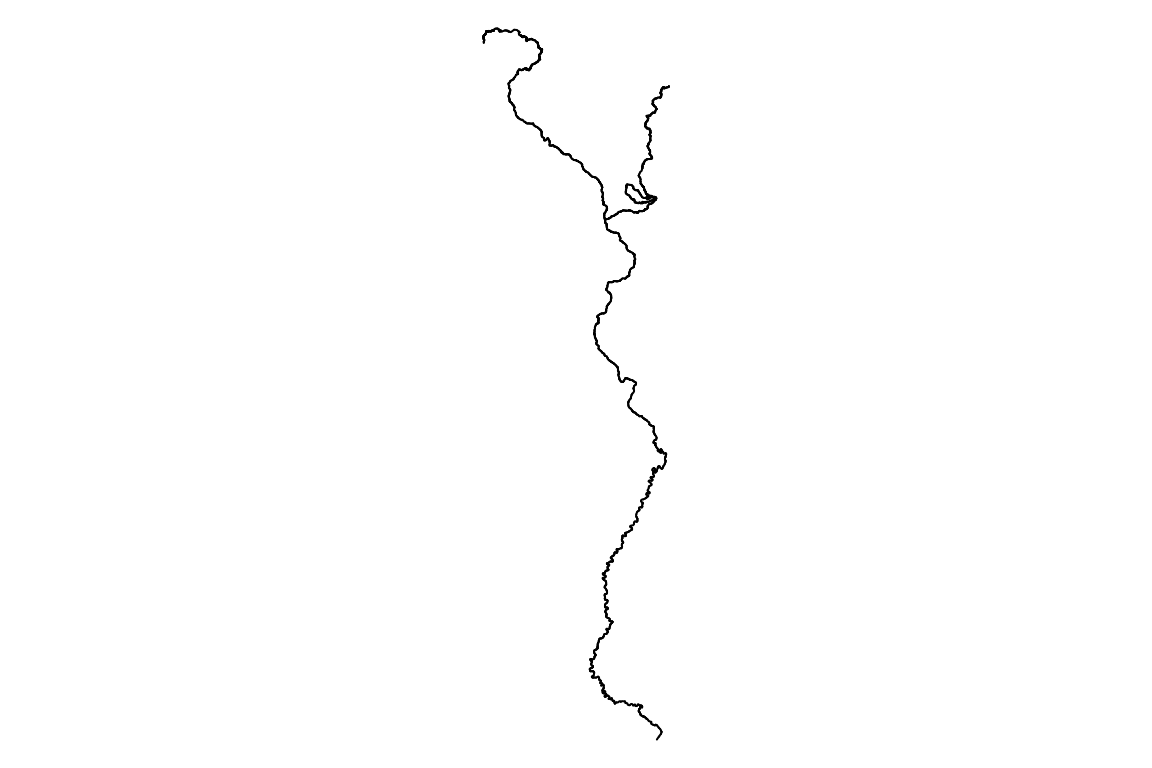
par(old_par)Neat. Now we have flowlines, waterbodies, a basin boundary, and major rivers downstream to work with. These could be saved to a local file for use in a GIS or used in some further analysis.
This service is brand new and hydrogeofetch is just
getting going with functionality to support what’s shown here. Please submit
issues if you find problems or have questions!!