U.S. Data and Package Basics
dblodgett@usgs.gov
Source:vignettes/hydrogeofetch.Rmd
hydrogeofetch.RmdTL;DR
Pick an outlet location and download some data.
# Uncomment to install!
# install.packages("hydrogeofetch")

library(hydrogeofetch)
library(sf)

start_point <- st_sfc(st_point(c(-89.362239, 43.090266)), crs = 4269)
start_comid <- discover_nhdplus_id(start_point)
#> GET https://api.water.usgs.gov/fabric/pygeoapi/collections/catchmentsp/items?bbox=-89.362239,43.090266,-89.362239,43.090266&properties=featureid&skipGeometry=true

flowline <- navigate_nldi(list(featureSource = "comid",
                               featureID = start_comid),
                          mode = "upstreamTributaries",
                          distance_km = 1000)

subset_file <- tempfile(fileext = ".gpkg")
subset <- subset_nhdplus(comids = as.integer(flowline$UT$nhdplus_comid),
                         output_file = subset_file,
                         nhdplus_data = "download",
                         flowline_only = FALSE,
                         return_data = TRUE, overwrite = TRUE)
#> POST https://api.water.usgs.gov/fabric/pygeoapi/collections/nhdflowline_network/items?limit=500&offset=0
#> {"op":"in","args":[{"property":"comid"},[13293376,13293378,13293380,13293382,13293384,13293386,13293388,13293390,13293392,13293394,13293396,13293398,13293400,13293404,13293406,13293410,13293412,13293416,13293418,13293420,13293422,13293424,13293426,13293428,13293430,13293432,13293434,13293436,13293438,13293440,13293442,13293444,13293446,13293448,13293450,13293452,13293454,13293456,13293458,13293460,13293462,13293464,13293468,13293472,13293474,13293476,13293478,13293480,13293484,13293486,13293488,13293490,13293492,13293494,13293496,13293498,13293502,13293504,13293506,13293508,13293512,13293514,13293516,13293518,13293520,13293522,13293524,13293526,13293530,13293532,13293536,13293540,13293542,13293548,13293550,13293552,13293554,13293556,13293558,13293562,13293564,13293568,13293570,13293572,13293574,13293576,13293578,13293584,13293586,13293588,13293590,13293600,13293612,13293614,13293620,13293624,13293634,13293646,13293672,13293674,13293676,13293678,13293688,13293690,13293692,13293694,13293696,13293750,13294110,13294112,13294114,13294116,13294118,13294120,13294122,13294124,13294128,13294130,13294132,13294134,13294138,13294140,13294144,13294148,13294150,13294152,13294154,13294158,13294166,13294168,13294174,13294176,13294178,13294184,13294264,13294268,13294270,13294272,13294274,13294276,13294278,13294280,13294282,13294284,13294286,13294288,13294290,13294292,13294294,13294296,13294298,13294300,13294304,13294306,13294308,13294310,13294312,13294314,13294366,13294368,13294382,13294384,13294386,13294394,13302588,13302590,937090090,937090091]]}
#> POST https://api.water.usgs.gov/fabric/pygeoapi/collections/catchmentsp/items?limit=500&offset=0
#> {"op":"in","args":[{"property":"featureid"},[13293376,13293378,13293380,13293382,13293384,13293386,13293388,13293390,13293392,13293394,13293396,13293398,13293400,13293404,13293406,13293410,13293412,13293416,13293418,13293420,13293422,13293424,13293426,13293428,13293430,13293432,13293434,13293436,13293438,13293440,13293442,13293444,13293446,13293448,13293450,13293452,13293454,13293456,13293458,13293460,13293462,13293464,13293468,13293472,13293474,13293476,13293478,13293480,13293484,13293486,13293488,13293490,13293492,13293494,13293496,13293498,13293502,13293504,13293506,13293508,13293512,13293514,13293516,13293518,13293520,13293522,13293524,13293526,13293530,13293532,13293536,13293540,13293542,13293548,13293550,13293552,13293554,13293556,13293558,13293562,13293564,13293568,13293570,13293572,13293574,13293576,13293578,13293584,13293586,13293588,13293590,13293600,13293612,13293614,13293620,13293624,13293634,13293646,13293672,13293674,13293676,13293678,13293688,13293690,13293692,13293694,13293696,13293750,13294110,13294112,13294114,13294116,13294118,13294120,13294122,13294124,13294128,13294130,13294132,13294134,13294138,13294140,13294144,13294148,13294150,13294152,13294154,13294158,13294166,13294168,13294174,13294176,13294178,13294184,13294264,13294268,13294270,13294272,13294274,13294276,13294278,13294280,13294282,13294284,13294286,13294288,13294290,13294292,13294294,13294296,13294298,13294300,13294304,13294306,13294308,13294310,13294312,13294314,13294366,13294368,13294382,13294384,13294386,13294394,13302588,13302590,937090090,937090091]]}
#> GET https://api.water.usgs.gov/fabric/pygeoapi/collections/nhdarea/items?bbox=-89.604801,43.035073,-89.203787,43.366077&limit=500&offset=0
#> GET https://api.water.usgs.gov/fabric/pygeoapi/collections/nhdwaterbody/items?bbox=-89.604801,43.035073,-89.203787,43.366077&limit=500&offset=0
#> GET https://api.water.usgs.gov/fabric/pygeoapi/collections/nhdflowline_nonnetwork/items?bbox=-89.604801,43.035073,-89.203787,43.366077&limit=500&offset=0

flowline <- subset$NHDFlowline_Network
catchment <- subset$CatchmentSP
waterbody <- subset$NHDWaterbody

## Or using a file:

flowline <- sf::read_sf(subset_file, "NHDFlowline_Network")
catchment <- sf::read_sf(subset_file, "CatchmentSP")
waterbody <- sf::read_sf(subset_file, "NHDWaterbody")

plot(sf::st_geometry(flowline), col = "blue")
plot(start_point, cex = 1.5, lwd = 2, col = "red", add = TRUE)
plot(sf::st_geometry(catchment), add = TRUE)
plot(sf::st_geometry(waterbody), col = rgb(0, 0, 1, alpha = 0.5), add = TRUE)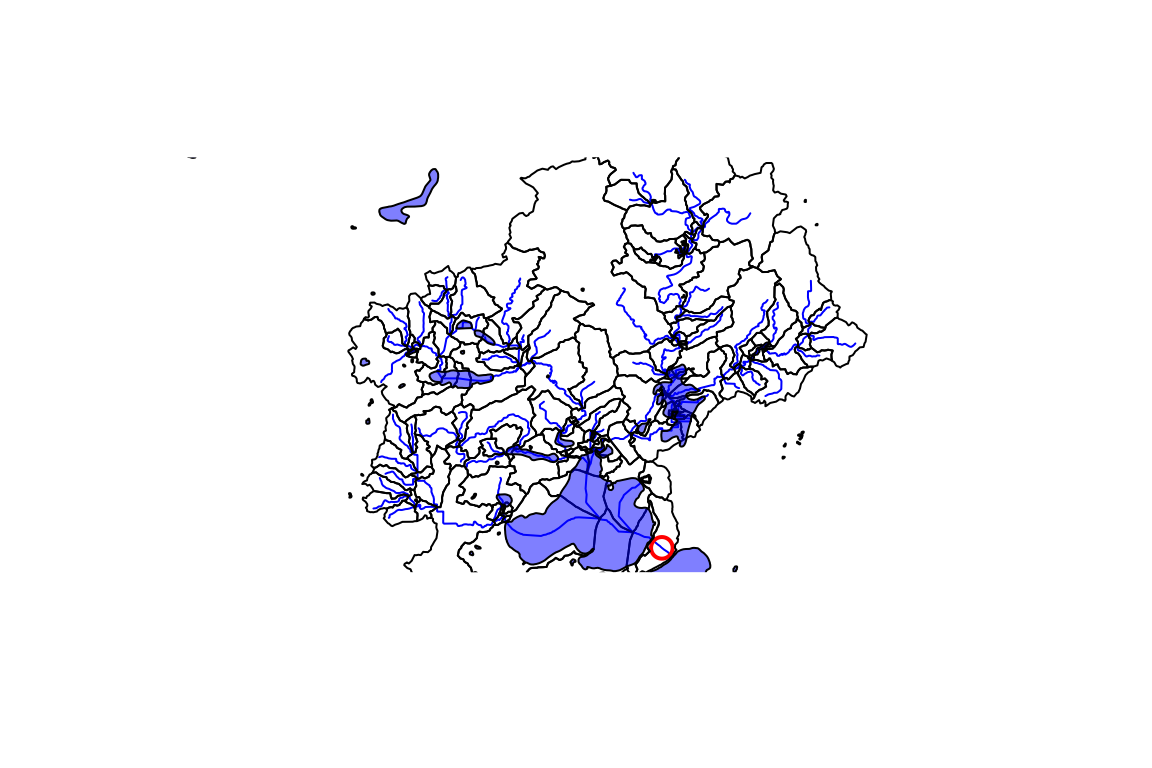
Or fetch an NWIS site as the starting point and generate a plot. Data is returned and/or stored in a local file for later use.
# ?plot_nhdplus for more
plot_data <- plot_nhdplus(
  outlets = list(featureSource = "nwissite", featureID = "USGS-05428500"),
  gpkg = subset_file, overwrite = TRUE)
#> GET https://api.water.usgs.gov/nldi/linked-data/nwissite/USGS-05428500/basin?simplify=true&splitCatchment=false
#> GET https://api.water.usgs.gov/fabric/pygeoapi/collections/nhdflowline_network/items?bbox=-89.604655,43.035066,-89.20378,43.366069&filter=streamorde%20>%202&limit=500&offset=0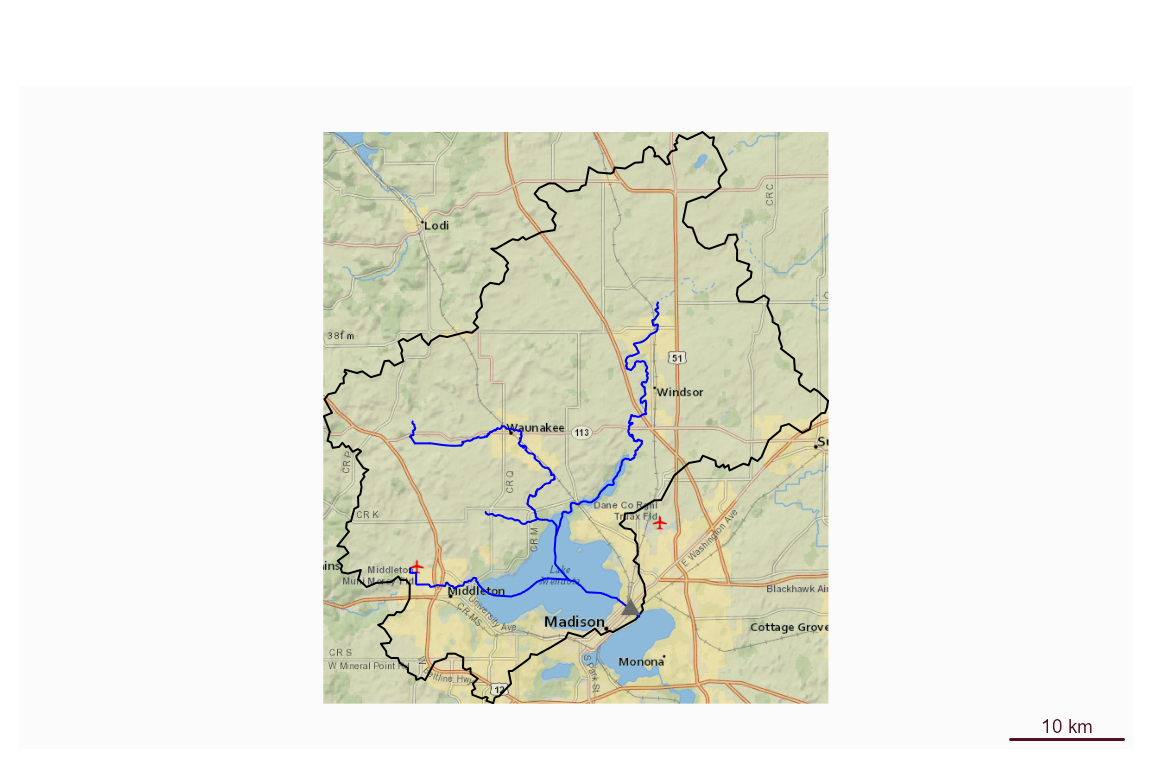
This vignette covers a range of utilities the hydrogeofetch package offers for working with data in a U.S. context.
The first thing you are going to need to do is go get some data to
work with. hydrogeofetch provides the ability to download
small subsets of the NHDPlus directly from web services. For large
subsets, greater than a few thousand square kilometers, you can use
download_nhdplusv2().
If you are working with the whole National Seamless database,
hydrogeofetch has some convenience functions you should be
aware of. Once you have it downloaded and extracted, you can tell the
hydrogeofetch package where it is with the nhdplus_path()
function.
This vignette stages its data in a working directory. Set
work_dir to wherever you want downloaded and sample data to
live.
work_dir <- file.path(hydrogeofetch_data_dir(), "nhdpt_v_cache")

dir.create(work_dir, showWarnings = FALSE, recursive = TRUE)
nhdplus_path(file.path(work_dir, "natseamless.gpkg"))

basename(nhdplus_path())
#> [1] "natseamless.gpkg"
If you don’t need or want all the geometry for the flowlines,
consider using get_vaa(). It allows you to retrieve
specific NHDPlus attributes with very little overhead. It also supports
access to an updated set of network attributes that incorporate numerous
network updates from national hydrologic modeling projects.
vaa <- get_vaa()
names(vaa)
#>  [1] "comid"      "streamleve" "streamorde" "streamcalc" "fromnode"
#>  [6] "tonode"     "hydroseq"   "levelpathi" "pathlength" "terminalpa"
#> [11] "arbolatesu" "divergence" "startflag"  "terminalfl" "dnlevel"
#> [16] "thinnercod" "uplevelpat" "uphydroseq" "dnlevelpat" "dnminorhyd"
#> [21] "dndraincou" "dnhydroseq" "frommeas"   "tomeas"     "reachcode"
#> [26] "lengthkm"   "fcode"      "vpuin"      "vpuout"     "areasqkm"
#> [31] "totdasqkm"  "divdasqkm"  "totma"      "wbareatype" "pathtimema"
#> [36] "slope"      "slopelenkm" "ftype"      "gnis_name"  "gnis_id"
#> [41] "wbareacomi" "hwnodesqkm" "rpuid"      "vpuid"      "roughness"
nrow(vaa)
#> [1] 2691339
NHDPlus HiRes
NHDPlus HiRes is an in-development dataset that introduces much more
dense flowlines and catchments. In the long run,
hydrogeofetch will have complete support for NHDPlus HiRes.
So far, hydrogeofetch will help download and interface
NHDPlus HiRes data with existing hydrogeofetch
functionality. It’s important to note that hydrogeofetch
was primarily implemented using NHDPlusV2 and any use of HiRes should be
subject to scrutiny.
For the demo below, a small sample of HiRes data is staged into
work_dir (the working directory set above) and read from
there. The first line shows how you can download additional data (just
change download_files to TRUE).
download_nhdplushr(nhd_dir = "download_dir",
                   hu_list = c("0101"), # can mix hu02 and hu04 codes.
                   download_files = FALSE) # TRUE will download files.
#> [1] "https://prd-tnm.s3.amazonaws.com/StagedProducts/Hydrography/NHDPlusHR/VPU/Current/GDB/NHDPLUS_H_0101_HU4_20220901_GDB.zip"

out_gpkg <- file.path(work_dir, "nhd_hr.gpkg")
hr_data <- get_nhdplushr(work_dir,
                         out_gpkg = out_gpkg)
(layers <- st_layers(out_gpkg))
#> Driver: GPKG
#> Available layers:
#>         layer_name geometry_type features fields             crs_name
#> 1      NHDFlowline   Line String     2691     57 GRS 1980(IUGG, 1980)
#> 2 NHDPlusCatchment Multi Polygon     2603      7 GRS 1980(IUGG, 1980)
#> 3     NHDWaterbody       Polygon     1044     15 GRS 1980(IUGG, 1980)
#> 4          NHDArea       Polygon       10     14 GRS 1980(IUGG, 1980)
#> 5          NHDLine   Line String      142     12 GRS 1980(IUGG, 1980)
#> 6      NHDPlusSink         Point        1     10 GRS 1980(IUGG, 1980)
#> 7         NHDPoint      3D Point        7     10 GRS 1980(IUGG, 1980)
names(hr_data)
#> [1] "NHDFlowline"      "NHDPlusCatchment"
unlink(out_gpkg)

hr_data <- get_nhdplushr(work_dir,
                         out_gpkg = out_gpkg,
                         layers = NULL)
(layers <- st_layers(out_gpkg))
#> Driver: GPKG
#> Available layers:
#>         layer_name geometry_type features fields             crs_name
#> 1      NHDFlowline   Line String     2691     57 GRS 1980(IUGG, 1980)
#> 2 NHDPlusCatchment Multi Polygon     2603      7 GRS 1980(IUGG, 1980)
#> 3     NHDWaterbody       Polygon     1044     15 GRS 1980(IUGG, 1980)
#> 4          NHDArea       Polygon       10     14 GRS 1980(IUGG, 1980)
#> 5          NHDLine   Line String      142     12 GRS 1980(IUGG, 1980)
#> 6      NHDPlusSink         Point        1     10 GRS 1980(IUGG, 1980)
#> 7         NHDPoint      3D Point        7     10 GRS 1980(IUGG, 1980)
names(hr_data)
#> [1] "NHDFlowline"      "NHDPlusCatchment" "NHDWaterbody"     "NHDArea"
#> [5] "NHDLine"          "NHDPlusSink"      "NHDPoint"
Discovery and Subsetting
One of the primary workflows hydrogeofetch is designed
to accomplish can be described in three steps:
- what NHDPlus catchment is at the outlet of a watershed,
- figure out what catchments are up or downstream of that catchment, and
- create a stand alone subset for that collection of catchments.
Say we want to get a subset of the NHDPlus upstream of a given
location. We can start with discover_nhdplus_id() First,
let’s look at a given point location. Then see where it is relative to
our flowlines.
lon <- -89.36
lat <- 43.09

start_point <- sf::st_sfc(sf::st_point(c(lon, lat)),
                          crs = 4269)

plot(sf::st_geometry(flowline))
plot(start_point, cex = 1.5, lwd = 2, col = "red", add = TRUE)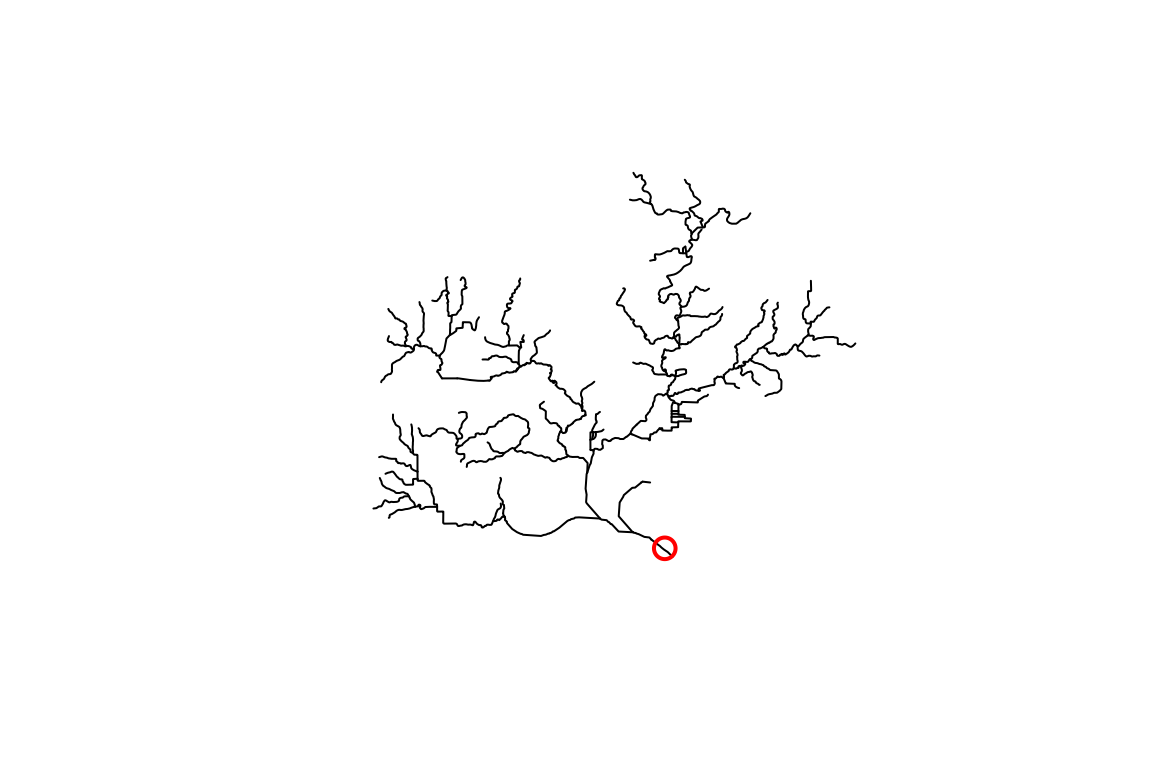
OK, so we have a point location near a river and we want to figure
out what catchment is at its outlet. We can use the
discover_nhdplus_id() function which calls out to a web
service and returns an NHDPlus catchment identifier, typically called a
COMID.
If we set raindrop = TRUE, we can also get a elevation
derived downslope trace to the nearest flowline and some additional
info. See get_raindrop_trace() for more on this
functionality.
start_comid <- discover_nhdplus_id(start_point, raindrop = TRUE)
#> POST https://api.water.usgs.gov/nldi/pygeoapi/processes/nldi-flowtrace/execution
#> {
#>   "inputs": [
#>     {
#>       "id": "lat",
#>       "type": "text/plain",
#>       "value": "43.09"
#>     },
#>     {
#>       "id": "lon",
#>       "type": "text/plain",
#>       "value": "-89.36"
#>     },
#>     {
#>       "id": "raindroptrace",
#>       "type": "text/plain",
#>       "value": "true"
#>     },
#>     {
#>       "id": "direction",
#>       "type": "text/plain",
#>       "value": "none"
#>     }
#>   ]
#> }
start_comid
#> Simple feature collection with 2 features and 7 fields
#> Geometry type: LINESTRING
#> Dimension:     XY
#> Bounding box:  xmin: -89.37038 ymin: 43.08522 xmax: -89.35394 ymax: 43.09492
#> Geodetic CRS:  WGS 84
#> # A tibble: 2 × 8
#>   id    gnis_name   comid reachcode raindrop_pathDist measure intersection_point
#> * <chr> <chr>       <int> <chr>                 <dbl>   <dbl> <list>
#> 1 nhdF… Yahara R…  1.33e7 07090002…              91.3    42.3 <dbl [2]>
#> 2 rain… <NA>      NA      <NA>                   NA      NA   <dbl [0]>
#> # ℹ 1 more variable: geometry <LINESTRING [°]>

plot(sf::st_geometry(start_comid))
plot(sf::st_geometry(flowline), add = TRUE, col = "blue", lwd = 2)
plot(start_point, cex = 1.5, lwd = 2, col = "red", add = TRUE)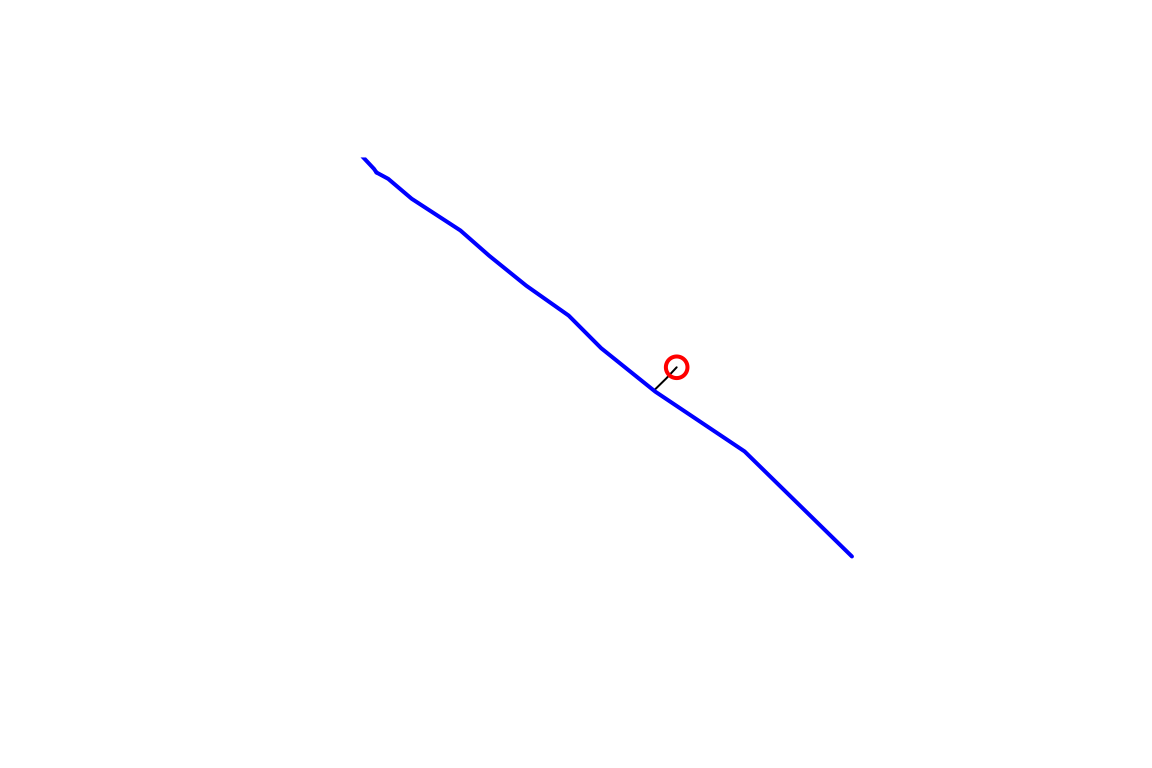
If you have the whole National Seamless database and want to work at regional to national scales, skip down to the Local Data Subsetting section.
Web Service Data Subsetting
hydrogeofetch supports discovery and data subsetting
using web services made available through the Network Linked Data
Index (NLDI) and the Water Mission Area
pygeoapi. The code below shows how to use the NLDI functions to
build a dataset upstream of our start_comid that we found
above.
The NLDI can be queried with any set of watershed outlet locations that it has in its index. We call these “featureSources”. We can query the NLDI for an identifier of a given feature from any of its “featureSources” and find out what our navigation options are as shown below.
dataRetrieval::get_nldi_sources()$source
#>  [1] "comid"             "huc12pp"           "WQP"
#>  [4] "nwissite"          "wade"              "ref_gage"
#>  [7] "ca_gages"          "gfv11_pois"        "vigil"
#> [10] "nwisgw"            "nmwdi-st"          "geoconnex-demo"
#> [13] "epa_nrsa"          "census2020-nhdpv2" "npdes"
#> [16] "huc12pp_102020"    "ref_dams"          "wade_rights"
#> [19] "wade_timeseries"   "GRAND"             "HILARRI"

nldi_feature <- list(featureSource = "comid",
                     featureID = as.integer(start_comid$comid)[1])

get_nldi_feature(nldi_feature)
#> Simple feature collection with 1 feature and 3 fields
#> Geometry type: LINESTRING
#> Dimension:     XY
#> Bounding box:  xmin: -89.37037 ymin: 43.08521 xmax: -89.35393 ymax: 43.09491
#> Geodetic CRS:  WGS 84
#> # A tibble: 1 × 4
#>   sourceName    identifier    comid                                     geometry
#>   <chr>         <chr>         <int>                             <LINESTRING [°]>
#> 1 NHDPlus comid 13293750   13293750 (-89.37037 43.09491, -89.36997 43.09475, -8…
We can use get_nldi_feature() as a way to make sure the
featureID is available for the chosen “featureSource”. Now that we know
the NLDI has our comid, we can use the “upstreamTributaries” navigation
option to get all the flowlines upstream or all the features from any of
the “featureSources” as shown below.
flowline_nldi <- navigate_nldi(nldi_feature,
                               mode = "upstreamTributaries",
                               distance_km = 1000)

plot(sf::st_geometry(flowline), lwd = 3, col = "black")
plot(sf::st_geometry(flowline_nldi$origin), lwd = 3, col = "red", add = TRUE)
plot(sf::st_geometry(flowline_nldi$UT), lwd = 1, col = "red", add = TRUE)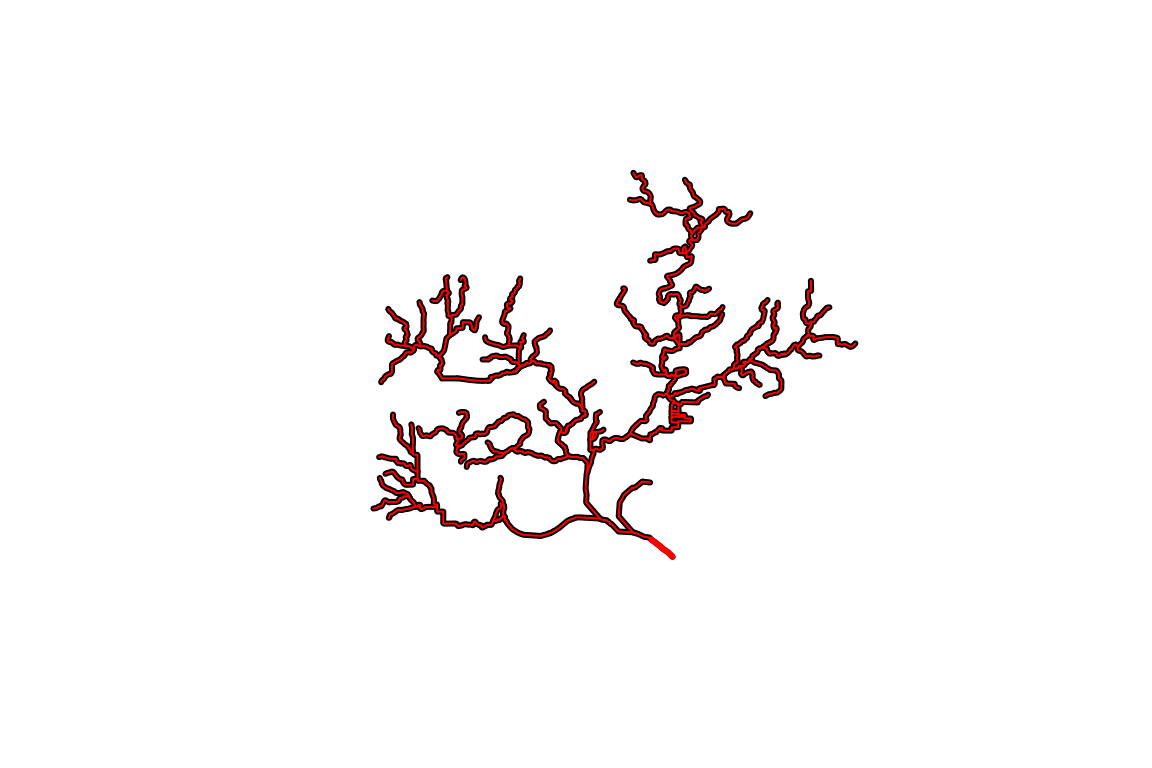
The NLDI only provides geometry and a comid for each of the
flowlines. The subset_nhdplus() function has a “download”
option that allows us to download four layers and all attributes as
shown below.
output_file_download <- file.path(work_dir, "subset_download.gpkg")

output_file_download <-subset_nhdplus(comids = as.integer(flowline_nldi$UT$nhdplus_comid),
                                      output_file = output_file_download,
                                      nhdplus_data = "download", return_data = FALSE,
                                      overwrite = TRUE)
#> POST https://api.water.usgs.gov/fabric/pygeoapi/collections/nhdflowline_network/items?limit=500&offset=0
#> {"op":"in","args":[{"property":"comid"},[13293376,13293378,13293380,13293382,13293384,13293386,13293388,13293390,13293392,13293394,13293396,13293398,13293400,13293404,13293406,13293410,13293412,13293416,13293418,13293420,13293422,13293424,13293426,13293428,13293430,13293432,13293434,13293436,13293438,13293440,13293442,13293444,13293446,13293448,13293450,13293452,13293454,13293456,13293458,13293460,13293462,13293464,13293468,13293472,13293474,13293476,13293478,13293480,13293484,13293486,13293488,13293490,13293492,13293494,13293496,13293498,13293502,13293504,13293506,13293508,13293512,13293514,13293516,13293518,13293520,13293522,13293524,13293526,13293530,13293532,13293536,13293540,13293542,13293548,13293550,13293552,13293554,13293556,13293558,13293562,13293564,13293568,13293570,13293572,13293574,13293576,13293578,13293584,13293586,13293588,13293590,13293600,13293612,13293614,13293620,13293624,13293634,13293646,13293672,13293674,13293676,13293678,13293688,13293690,13293692,13293694,13293696,13293750,13294110,13294112,13294114,13294116,13294118,13294120,13294122,13294124,13294128,13294130,13294132,13294134,13294138,13294140,13294144,13294148,13294150,13294152,13294154,13294158,13294166,13294168,13294174,13294176,13294178,13294184,13294264,13294268,13294270,13294272,13294274,13294276,13294278,13294280,13294282,13294284,13294286,13294288,13294290,13294292,13294294,13294296,13294298,13294300,13294304,13294306,13294308,13294310,13294312,13294314,13294366,13294368,13294382,13294384,13294386,13294394,13302588,13302590,937090090,937090091]]}

sf::st_layers(output_file_download)
#> Driver: GPKG
#> Available layers:
#>            layer_name geometry_type features fields crs_name
#> 1 NHDFlowline_Network   Line String      168    138    NAD83

flowline_download <- sf::read_sf(file.path(work_dir, "subset_download.gpkg"),
                                 "NHDFlowline_Network")

plot(sf::st_geometry(dplyr::filter(flowline_download,
                                   streamorde > 2)),
     lwd = 7, col = "darkgrey")
plot(sf::st_geometry(flowline_nldi$UT),
     lwd = 3, col = "red", add = TRUE)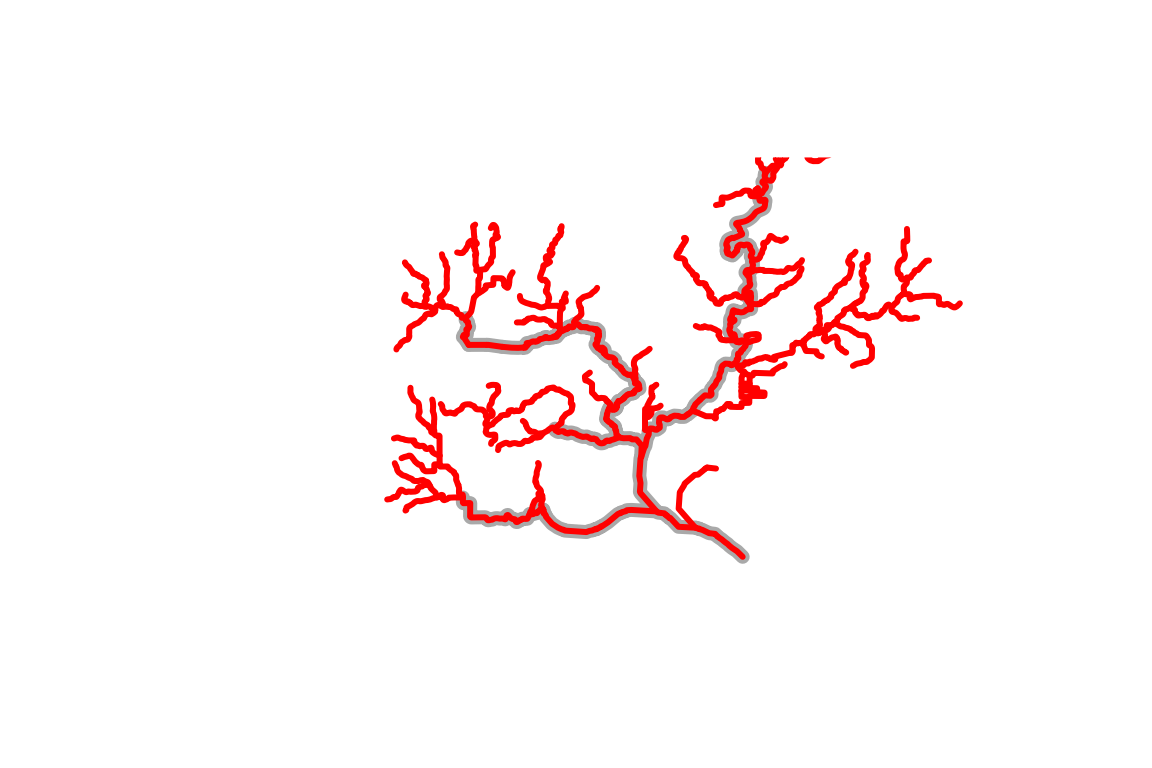
This plot illustrates the kind of thing that’s possible (filtering to specific stream orders) using the attributes that are downloaded.
Before moving on, one more demonstration of what can be done using the NLDI. Say we knew the USGS gage ID that we want NHDPlus data upstream of. We can use the NLDI to navigate from the gage the same as we did for our comid. We can also get back all the nwis sites the NLDI knows about upstream of the one we chose!
nldi_feature <- list(featureSource = "nwissite",
                     featureID = "USGS-05428500")

flowline_nldi <- navigate_nldi(nldi_feature,
                               mode = "upstreamTributaries",
                               distance_km = 1000)

output_file_nwis <- file.path(work_dir, "subset_download_nwis.gpkg")

output_file_nwis <-subset_nhdplus(comids = as.integer(flowline_nldi$UT$nhdplus_comid),
                                  output_file = output_file_nwis,
                                  nhdplus_data = "download",
                                  return_data = FALSE, overwrite = TRUE)

sf::st_layers(output_file_download)
#> Driver: GPKG
#> Available layers:
#>            layer_name geometry_type features fields crs_name
#> 1 NHDFlowline_Network   Line String      168    138    NAD83

flowline_nwis <- sf::read_sf(output_file_nwis,
                                 "NHDFlowline_Network")

upstream_nwis <- navigate_nldi(nldi_feature,
                               mode = "upstreamTributaries",
                               data_source = "nwissite",
                               distance_km = 1000)

plot(sf::st_geometry(flowline_nwis),
     lwd = 3, col = "blue")
plot(sf::st_geometry(upstream_nwis$UT_nwissite),
     cex = 1, lwd = 2, col = "red", add = TRUE)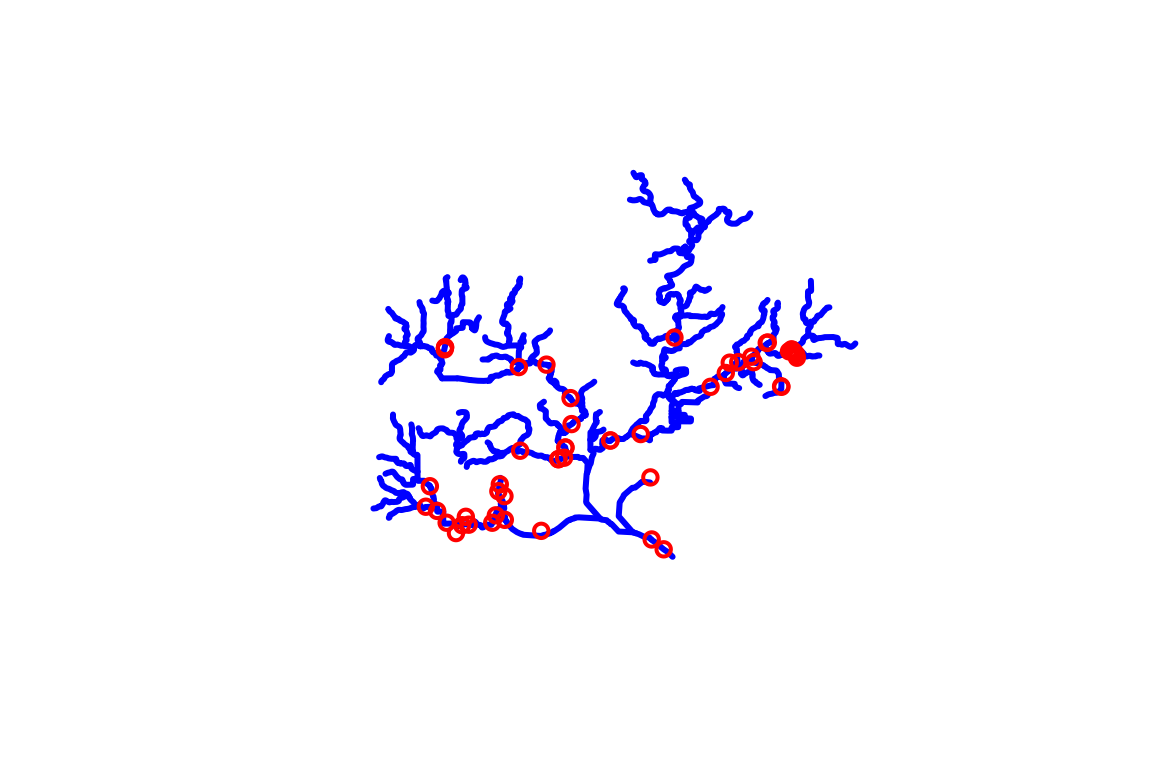
Local Data Subsetting
While web service data access is very convenient, some use cases make working with web services impossible or cumbersome such that working with local data is preferable. hydrogeofetch supports such workflows with hybrid, web-service and local, workflows.
With the starting COMID we found with
discover_nhdplus_id() above, we can use hydroloom’s
navigate_hydro_network() to retrieve a collection of COMIDs
along the upstream-with-tributaries network path.
UT_comids <- hydroloom::navigate_hydro_network(flowline, start_comid$comid[1], "UT")
UT_comids
#>   [1]  13293380  13293384  13293388  13293392  13293398  13293424  13293430
#>   [8]  13293454  13293504  13293506  13293576  13293750  13294110  13294128
#>  [15]  13294134  13294280  13294284  13294288  13294290  13294298  13294304
#>  [22]  13294310  13294312  13294394  13293376  13293382  13293386  13293390
#>  [29]  13293394  13293396  13293400  13293404  13293406  13293416  13293422
#>  [36]  13293426  13293432  13293434  13293440  13293444  13293446  13293452
#>  [43]  13293456  13293458  13293464  13293474  13293480  13293484  13293488
#>  [50]  13293492  13293494  13293496  13293508  13293520  13293524  13293526
#>  [57]  13293530  13293536  13293540  13293542  13293550  13293554  13293574
#>  [64]  13293584  13293588  13293612  13293620  13293634  13293676  13293694
#>  [71]  13293696  13294118  13294124  13294130  13294132  13294138  13294154
#>  [78]  13294158  13294166  13294264  13294268  13294272  13294274  13294276
#>  [85]  13294278  13294282  13294286  13294292  13294294  13294300  13294308
#>  [92]  13294314  13294366  13294368  13294382  13294384  13294386 937090090
#>  [99] 937090091  13293378  13293412  13293420  13293428  13293436  13293438
#> [106]  13293442  13293450  13293460  13293462  13293468  13293472  13293476
#> [113]  13293478  13293486  13293490  13293498  13293502  13293512  13293514
#> [120]  13293516  13293518  13293522  13293532  13293548  13293552  13293556
#> [127]  13293558  13293564  13293568  13293572  13293578  13293586  13293614
#> [134]  13293624  13293672  13293674  13293678  13293690  13293692  13294112
#> [141]  13294122  13294140  13294144  13294148  13294150  13294152  13294168
#> [148]  13294176  13294184  13294270  13294296  13294306  13302588  13302590
#> [155]  13293410  13293418  13293448  13293562  13293570  13293600  13293646
#> [162]  13293688  13294114  13294116  13294120  13294174  13294178  13293590
If you are familiar with the NHDPlus, you will recognize that now
that we have this list of COMIDs, we could go off and do all sorts of
things with the various flowline attributes. For now, let’s just use the
COMID list to filter our fline sf
data.frame and plot it with our other layers.
plot(sf::st_geometry(flowline))
plot(start_point, cex = 1.5, lwd = 2, col = "red", add = TRUE)
plot(sf::st_geometry(dplyr::filter(flowline, comid %in% UT_comids)),
     add=TRUE, col = "red", lwd = 2)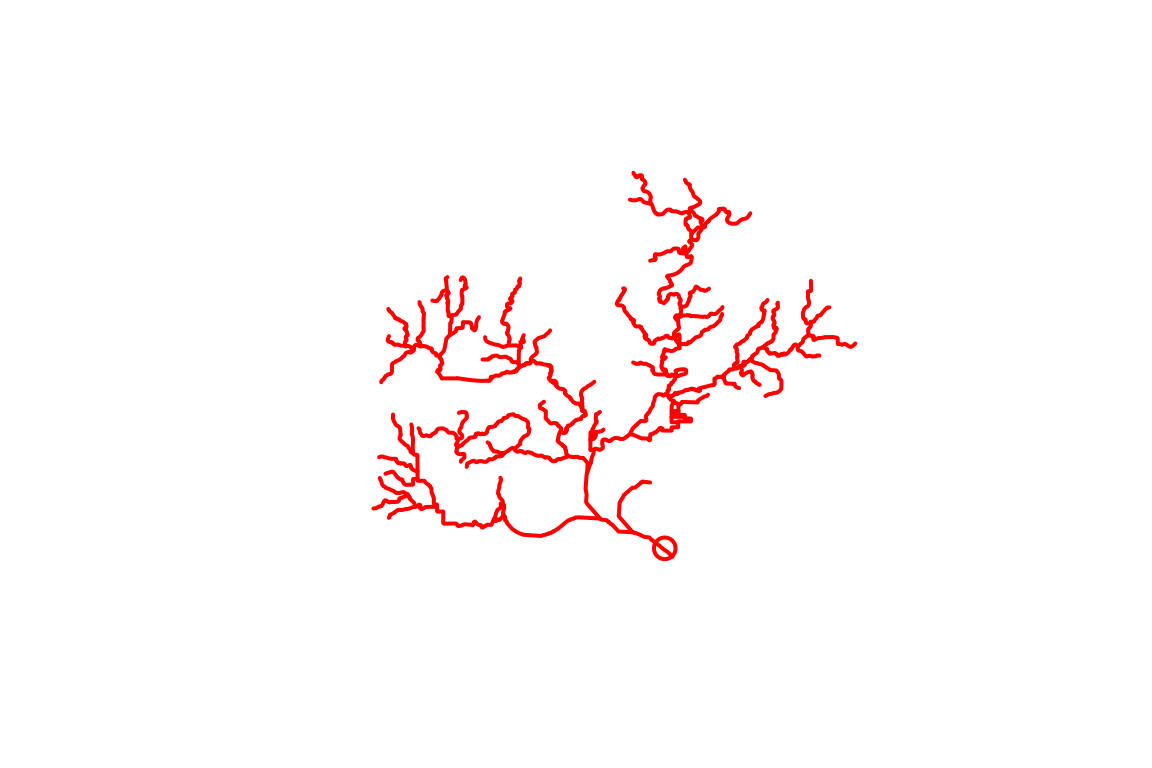
Say you want to save the network subset for later use in R or in some
other GIS. The subset_nhdplus() function is your friend. If
you have the whole national seamless database downloaded, you can pull
out large subsets of it like shown below (this queries for data from the
local geodatabase without loading the whole thing into memory). If you
don’t have the whole national seamless, look at the second example in
this section.
output_file <- file.path(work_dir, "subset.gpkg")

output_file <-subset_nhdplus(comids = UT_comids,
                             output_file = output_file,
                             nhdplus_data = nhdplus_path(),
                             return_data = FALSE, overwrite = TRUE)

sf::st_layers(output_file)
#> Driver: GPKG
#> Available layers:
#>               layer_name geometry_type features fields             crs_name
#> 1    NHDFlowline_Network   Line String      168    136 GRS 1980(IUGG, 1980)
#> 2            CatchmentSP                    167      6 GRS 1980(IUGG, 1980)
#> 3                NHDArea       Polygon        1     14 GRS 1980(IUGG, 1980)
#> 4           NHDWaterbody       Polygon       90     21 GRS 1980(IUGG, 1980)
#> 5 NHDFlowline_NonNetwork   Line String       45     12 GRS 1980(IUGG, 1980)
#> 6                   Gage         Point       33     19 GRS 1980(IUGG, 1980)
Now we have an output geopackage that can be used later. It contains the network subset of catchments and flowlines as well as a spatial subset of other layers as shown in the status output above. To complete the demonstration, here are a couple more layers plotted up.
catchment <- sf::read_sf(output_file, "CatchmentSP")
waterbody <- sf::read_sf(output_file, "NHDWaterbody")

plot(sf::st_geometry(flowline))
plot(start_point, cex = 1.5, lwd = 2, col = "red", add = TRUE)
plot(sf::st_geometry(dplyr::filter(flowline, comid %in% UT_comids)),
     add=TRUE, col = "red", lwd = 2)
plot(sf::st_geometry(catchment), add = TRUE)
plot(sf::st_geometry(waterbody), col = rgb(0, 0, 1, alpha = 0.5), add = TRUE)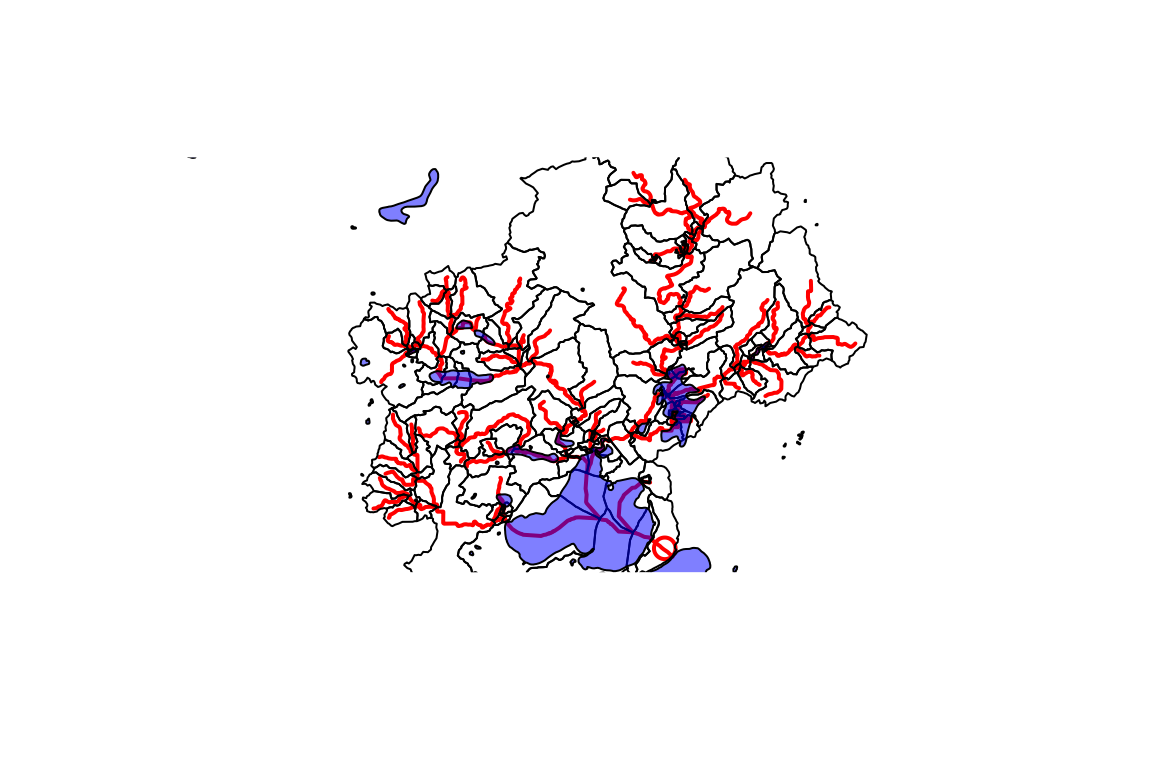
Indexing
Indexing functions have moved to the hydroloom package. Use hydrogeofetch to fetch flowline data and hydroloom to index points to those flowlines.
hydroloom::index_points_to_lines(flowline, start_point)
#>   point_id    comid id_measure      reachcode reachcode_measure       offset
#> 1        1 13293750   41.80031 07090002007373           41.8003 0.0009619034
index_points_to_lines() works with a list of points too.
For demonstration purposes, we can use the gages in our subset from
above.
gage <- sf::read_sf(output_file, "Gage")

hydroloom::index_points_to_lines(flowline, sf::st_geometry(gage), precision = 10)
#>    point_id    comid id_measure      reachcode reachcode_measure         offset
#> 1         2 13294276  14.835510 07090002008387           14.8355 0.000020891030
#> 2         3 13294264  56.443870 07090002007650           56.4439 0.000031104771
#> 3         4 13293750  42.508943 07090002007373           42.5089 0.000016222605
#> 4         5 13294312   1.221144 07090002008383            1.2211 0.000013118677
#> 5         6 13294264  41.051940 07090002007650           41.0519 0.000040136119
#> 6         7 13294264   2.087173 07090002007650            2.0872 0.000009600705
#> 7         9 13294300  85.444074 07090002008379           85.4441 0.000024421783
#> 8        10 13293690   6.969749 07090002007648            0.7642 0.000022907103
#> 9        11 13294264  71.404235 07090002007650           71.4042 0.008212854054
#> 10       13 13294176   6.117427 07090002007664            6.1174 0.000037883863
#> 11       15 13294290  88.021298 07090002008374           88.0213 0.000037222413
#> 12       16 13294138  73.371669 07090002007709           73.3717 0.000010914584
#> 13       18 13293486   8.853011 07090002007724            8.8530 0.000019633805
#> 14       19 13293512   5.986762 07090002007723            5.9868 0.000003962819
#> 15       20 13294176  16.995826 07090002007664           16.9958 0.000011728694
#> 16       22 13293474  72.081391 07090002007713           72.0814 0.000009896451
#> 17       23 13293520  18.194214 07090002007676           18.1942 0.000038997161
#> 18       26 13293512  68.171618 07090002007723           68.1716 0.000019188910
#> 19       27 13294264  97.167344 07090002007650           97.1673 0.000022821372
#> 20       29 13293456  90.836380 07090002007738           90.8364 0.000027257370
#> 21       31 13293512  67.622334 07090002007723           67.6223 0.000030945071
#> 22       33 13293576  62.499937 07090002008236            2.7112 0.000016468104
See the hydroloom indexing documentation and the migrating from nhdplusTools article for more.
Mainstems across networks
A mainstem (a river from its headwater to its outlet, identified by a
geoconnex ref/mainstems uri) is carried by NHDPlusV2,
NHDPlusHR and 3DHP, but each network breaks it into different flowlines
with different identifiers. get_mainstem_flowlines()
returns the flowlines of one or more mainstems from any of the three,
with mainstemid set to the mainstem uri and the topology
and length attributes hydroloom expects. With
include_confluences = TRUE it also returns the outlet
flowline of each identified tributary, which is what
hydroloom::get_confluences() needs to find where
tributaries join.
new_hope <- "https://geoconnex.us/ref/mainstems/2408056"

nh_3dhp <- get_mainstem_flowlines(new_hope, "3dhp", include_confluences = TRUE)
#> GET https://3dhp.nationalmap.gov/arcgis/rest/services/usgs_3dhp_all/FeatureServer/?f=json
#> POST https://3dhp.nationalmap.gov/arcgis/rest/services/usgs_3dhp_all/FeatureServer/50/query
#> POST https://3dhp.nationalmap.gov/arcgis/rest/services/usgs_3dhp_all/FeatureServer/50/query
#> POST https://3dhp.nationalmap.gov/arcgis/rest/services/usgs_3dhp_all/FeatureServer/50/query
#> POST https://3dhp.nationalmap.gov/arcgis/rest/services/usgs_3dhp_all/FeatureServer/50/query
#> POST https://3dhp.nationalmap.gov/arcgis/rest/services/usgs_3dhp_all/FeatureServer/50/query
#> Warning: Failed to get JSON from https://3dhp.nationalmap.gov/arcgis/rest/services/usgs_3dhp_all/FeatureServer/50/query: HTTP 504 Gateway Timeout.
#>   <!DOCTYPE HTML PUBLIC "-//W3C//DTD HTML 4.01 Transitional//EN" "http://www.w3.org/TR/html4/loose.dtd">
#> <HTML><HEAD><META HTTP-EQUIV="Content-Type" CONTENT="text/html; charset=UTF-8">
#> <TITLE>ERROR: The request could not be satisfied</TITLE>
#> </HEAD><BODY>
#> <H1>504 Gateway Timeout ERROR</H1>
#> <H2>The request could not be satisfied.</H2>
#> <HR noshade size="1px">
#> We can't connect to the server for this app or website at this time. There might be too much traffic or a configuration error. Try again later

confluences <- hydroloom::get_confluences(nh_3dhp)

confluences[grepl("/ref/", confluences$hydro_location_id), ]
#> # A tibble: 4 × 4
#>   mainstemid                                 hydro_location_id id3dhp id_measure
#>   <chr>                                      <chr>             <chr>       <dbl>
#> 1 https://geoconnex.us/ref/mainstems/2408056 https://geoconne… 4CVG8         100
#> 2 https://geoconnex.us/ref/mainstems/2408056 https://geoconne… 30HSV         100
#> 3 https://geoconnex.us/ref/mainstems/2408056 https://geoconne… 9MCXM         100
#> 4 https://geoconnex.us/ref/mainstems/2408056 https://geoconne… 5U5LZ         100
Because the mainstem uri is shared, a point or flowline indexed on
one network can be moved to another while staying on its own river — a
gage just above a confluence is not pulled onto the tributary.
translate_hydrolocations() does this for points in one of
two ways. method = "geometry" indexes each point to the
target flowlines of its mainstem. method = "hydro_location"
records each point as a distance from the nearest confluence that both
networks carry and lays that distance out on the target. The second is
approximate in absolute terms, since each network puts the confluence in
its own place, but it keeps the point on the same side of the
confluence. translate_flowlines() does the same for
flowlines, returning the pieces of target flowlines that cover each
source flowline.
Both functions read the ref_rivers lookup and updated network attribute tables for NHDPlusV2, which are large downloads on first use, so the calls below are not run here.
# a point on New Hope River just above the Northeast Creek mouth
pt <- sf::st_sf(comid = 8894344,
                geometry = sf::st_sfc(sf::st_point(c(-78.9763, 35.8355)),
                                      crs = 4326))

translate_hydrolocations(pt, "nhdpv2", "3dhp", method = "hydro_location")

# a Morgan Creek flowline
translate_flowlines(8896344, "nhdpv2", "3dhp")
Two properties of the data bound these results. 3DHP identifiers are
not persistent across releases, so a placement on 3DHP holds for the
release recorded in measured_on. The NHDPlusHR lookup in
ref_rivers v3.2 covers only part of the country (New Hope is not in it),
so "nhdphr" returns nothing for many mainstems.