Demonstration of how sfrmaker handles streambed elevations
[1]:
import glob
import os
import numpy as np
import pandas as pd
import flopy
fm = flopy.modflow
import matplotlib.pyplot as plt
from sfrmaker import Lines, StructuredGrid
from sfrmaker.utils import assign_layers
Run the first part of the Tyler Forks example problem to get an SFRData instance
[2]:
# DEM for sampling streambed top elevations
dem = '../tylerforks/dem_26715.tif'

# output folder
outdir = 'temp/'
if not os.path.isdir(outdir):
    os.mkdir(outdir)

# make an instance of the sfrmaker.Lines class from NHDPlus data
# use a shapefile of the model grid to filter what is read in
# (only flowlines within the bounding box of the grid are read)
lns = Lines.from_nhdplus_v2(NHDPlus_paths='../tylerforks/NHDPlus/',
                            bbox_filter='../tylerforks/grid.shp')

# load the model using flopy
m = fm.Modflow.load('tf.nam', model_ws='../tylerforks/tylerforks')

# Make a flopy StructuredGrid instance
# delr and delc have to specified in meters (consistent with projected CRS)
# the model has length units of feet
mg = flopy.discretization.StructuredGrid(delr=m.dis.delr.array * .3048,  # cell spacing along a row
                                         delc=m.dis.delc.array * .3048,  # cell spacing along a column
                                         xoff=682688, yoff=5139052,  # lower left corner of model grid
                                         angrot=0,  # grid is unrotated
                                         # projected coordinate system of model (UTM NAD27 zone 15 North)
                                         crs=26715
                                         )

# from the lines and StructuredGrid instances, make a sfrmaker.SFRData instance
# (lines are intersected with the model grid and converted to reaches, etc.)
# unfortunately there are 3 different ways to specify model length units
# SFRmaker will set the units in this order of priority:
# 1) as argued with model_length_units= (below)
# 2) units attached to sfrmaker.StructuredGrid instance
# 3) units attached to DIS package of flopy model
# if the grid or model dis package have valid units, any conversions should "just work"
# in any case, specifying units in the to_sfr call guarantees that the correct units will be used
sfr = lns.to_sfr(grid=mg, model=m, model_length_units='feet')
loading NHDPlus v2 hydrography data...
for basins:
../tylerforks/NHDPlus/

load finished in 0.11s

Getting routing information from NHDPlus Plusflow table...
finished in 0.01s


SFRmaker version 0.13.0.post15.dev0+g43040a2

Creating sfr dataset...

Creating grid class instance from flopy Grid instance...
grid class created in 0.28s

Model grid information
structured grid
nnodes: 17,760
nlay: 1
nrow: 111
ncol: 160
model length units: undefined
crs: EPSG:26715
bounds: 682688.00, 5139052.00, 694880.00, 5147510.20
active area defined by: all cells

MODFLOW 5 layer(s) 111 row(s) 160 column(s) 1 stress period(s)

reprojecting hydrography from
EPSG:4269
to
EPSG:26715


Culling hydrography to active area...
starting lines: 43
remaining lines: 42
finished in 0.00s


Intersecting 42 flowlines with 17,760 grid cells...

Building spatial index...
finished in 0.89s

Intersecting 42 features...
42
finished in 0.06s

Setting up reach data... (may take a few minutes for large grids)
finished in 0.25s

Computing widths...

Dropping 48 reaches with length < 12.50 feet...

Repairing routing connections...
enforcing best segment numbering...

Setting up segment data...
Model grid information
structured grid
nnodes: 17,760
nlay: 1
nrow: 111
ncol: 160
model length units: undefined
crs: EPSG:26715
bounds: 682688.00, 5139052.00, 694880.00, 5147510.20
active area defined by: all cells


Time to create sfr dataset: 1.73s
[3]:
import pyproj
pyproj.datadir.get_data_dir()
[3]:
'/Users/runner/micromamba/envs/sfrmaker_ci/share/proj'
Sample elevations from the DEM
the buffers method draws a buffer around each LineString representing a reach (default=100m), and then gets the minimum DEM elevation within that buffer, using the ``rasterstats`` package
alternatively, the ``cell polygons`` method would do the same thing using the model cell polygons instead to represent the reaches
get results with and without smoothing.
pseudo code for the smoothing algoritm:
Starting at the outlets to the stream network, list the reaches at each level (reaches that route to an outlet, reaches that route to reaches that route to an outlet, etc...)
For each level:
    For each stream reach within the level:
        Get the elevations of all upstream reaches (that route to that reach)
            Set the elevation as the minimum of the elevation sampled at the current reach and the elevations sampled at all upstream reaches.
[4]:
raw_sampled_elevs = sfr.sample_reach_elevations(dem, method='buffers', smooth=False)
smooth_sampled_elevs = sfr.sample_reach_elevations(dem, method='buffers', smooth=True)
running rasterstats.zonal_stats on buffered LineStrings...
finished in 5.79s

running rasterstats.zonal_stats on buffered LineStrings...
finished in 5.65s


Smoothing elevations...
finished in 0.10s
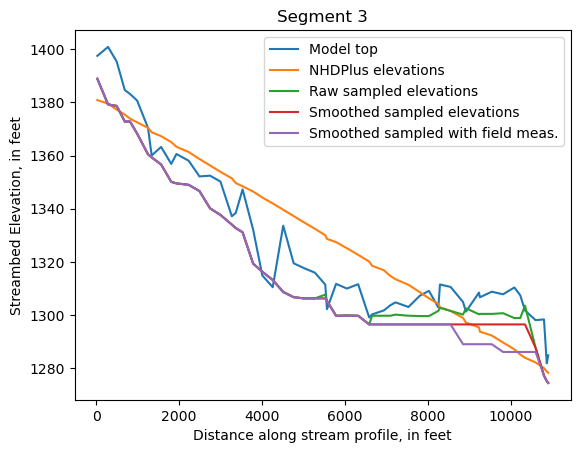
Including field measurements of streambed top elevation
Oftentimes, streambed elevations sampled from a DEM and smoothed are still biased high, because even the lowest DEM pixels near the stream don’t capture the true streambed top elevation, which is typically found within a channel that is narrow relative to the DEM pixel width, beneath some amount of water. When getting the streambed top elevations right is important, we may want to measure these in the field, and incorporate this data into the SFR Package. In SFRmaker this can be done by supplying a table of streambed top measurements with x, y locations. Suppose we collected some additional elevations for ‘Segment 3’ in the plots below:
[5]:
pd.read_csv('../tylerforks/streambed_elevations.csv')
[5]:
| x | y | elevation | |
|---|---|---|---|
| 0 | 692396.7 | 5140825.5 | 392.02 |
| 1 | 692608.2 | 5141000.6 | 392.91 |
We can include these in the streambed top elevation sampling via an elevation_data argument. Elevation data must be supplied in a tabular format as shown above. CSV, shapefiles or GeoPackages are supported, as are pandas DataFrames or Geopandas GeoDataFrames. If a CSV or regular DataFrame is supplied, the coordinates must be in the same CRS as the model/SFR Package, or an elevation_data_crs must be supplied.
[6]:
smooth_elevs_with_field_measurements = sfr.sample_reach_elevations(dem, method='buffers', smooth=True,
                                                                   elevation_data='../tylerforks/streambed_elevations.csv')
running rasterstats.zonal_stats on buffered LineStrings...
finished in 5.28s


Smoothing elevations...
finished in 0.13s
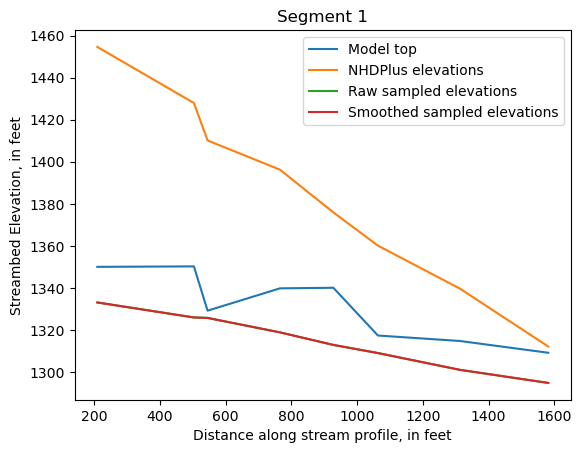
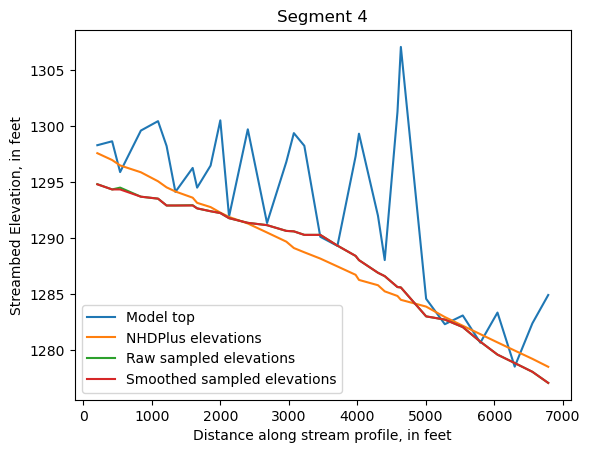
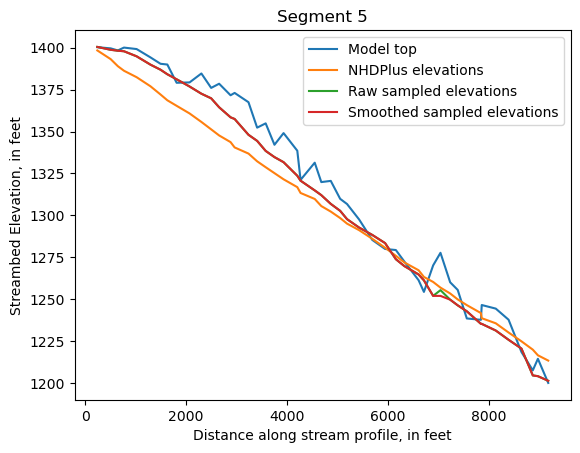
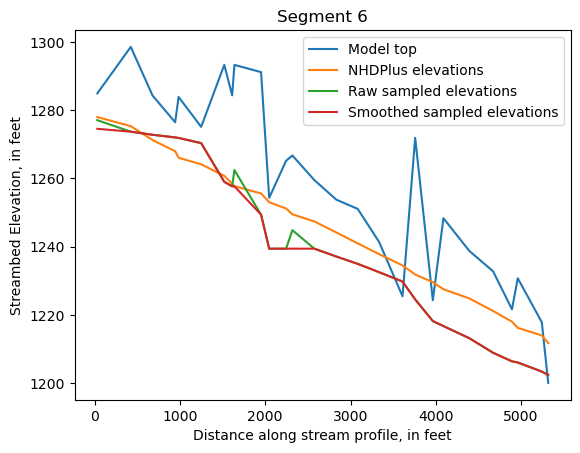
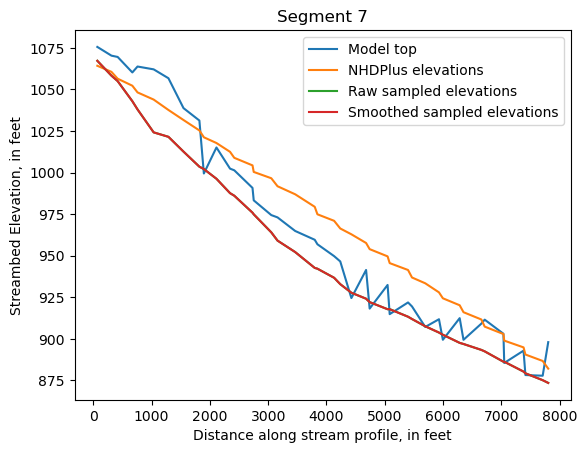
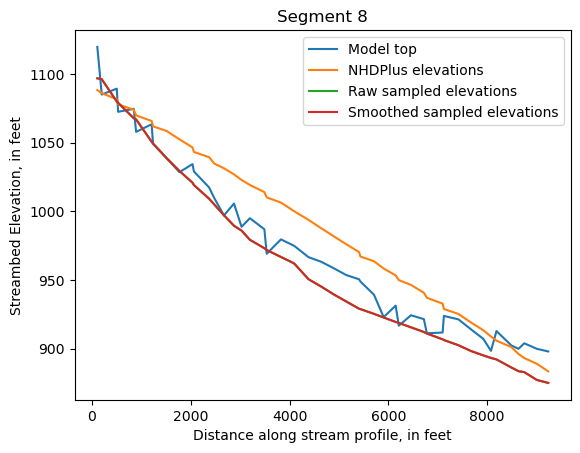
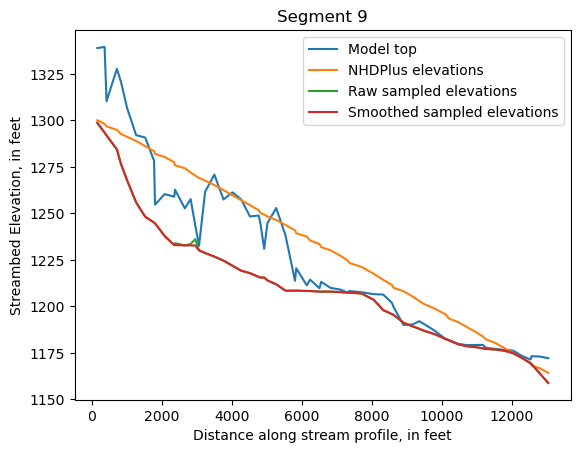
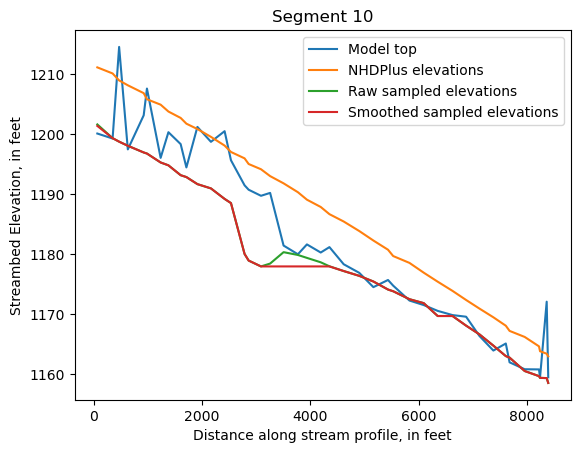
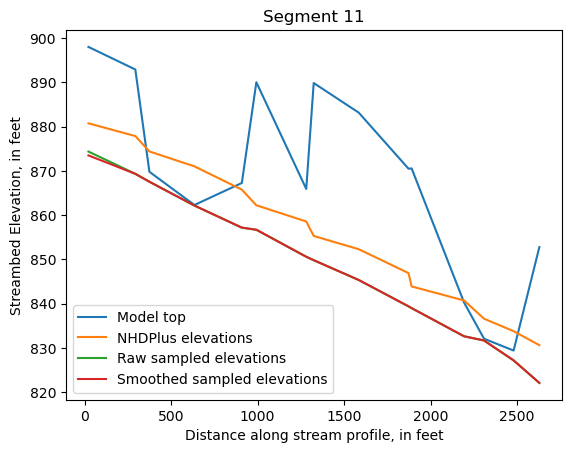
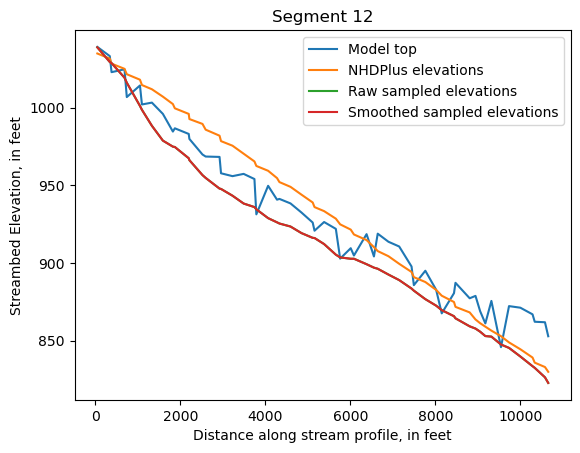
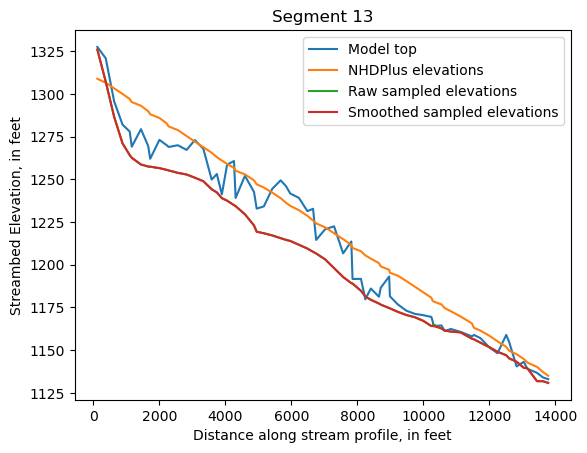
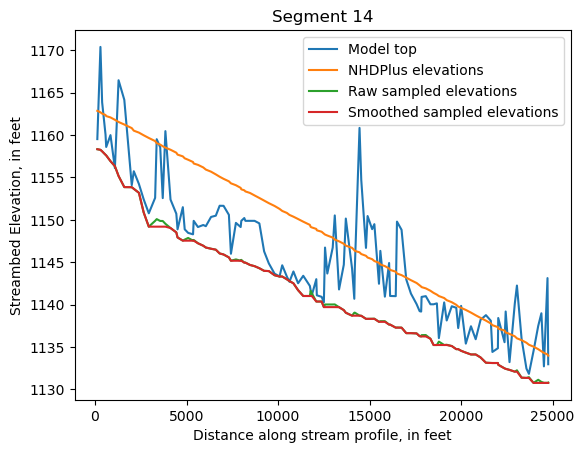
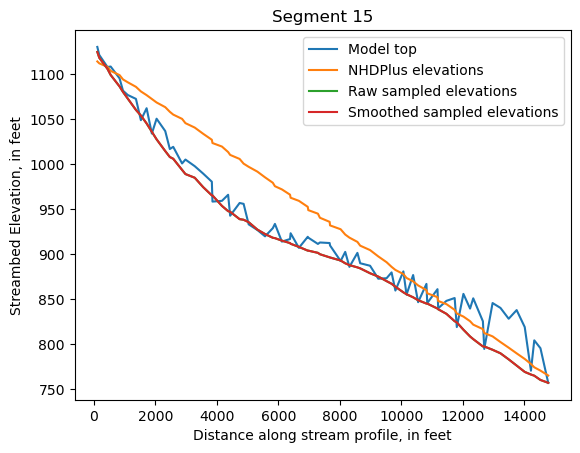
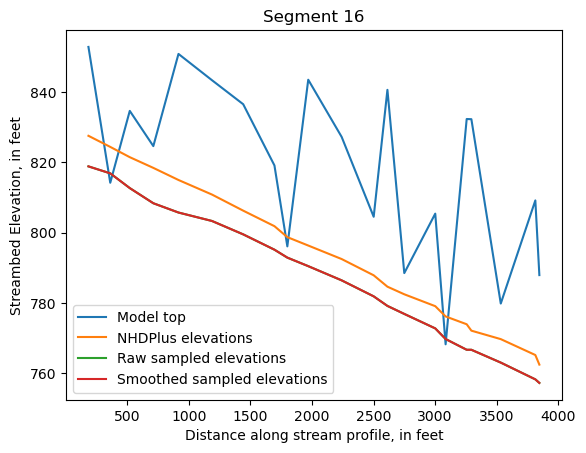
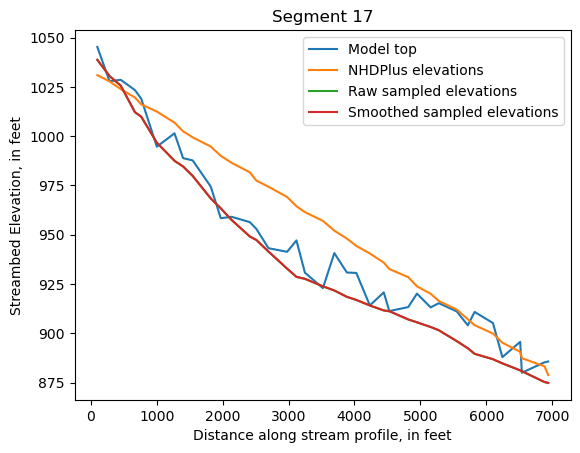
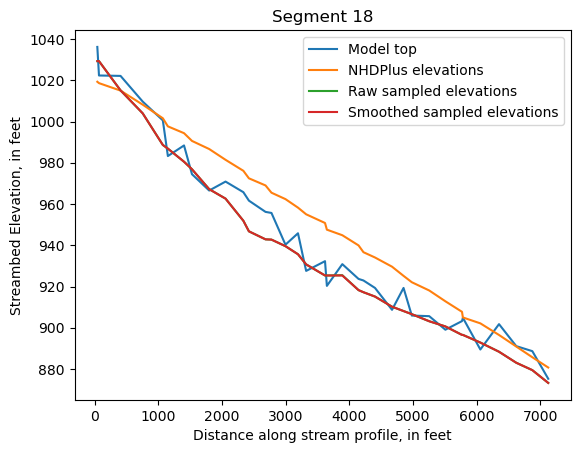
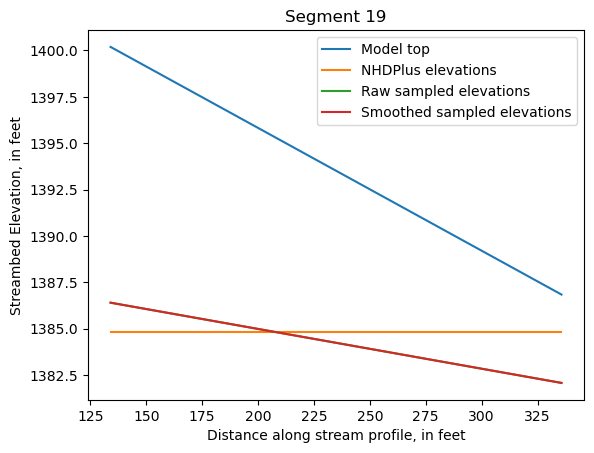
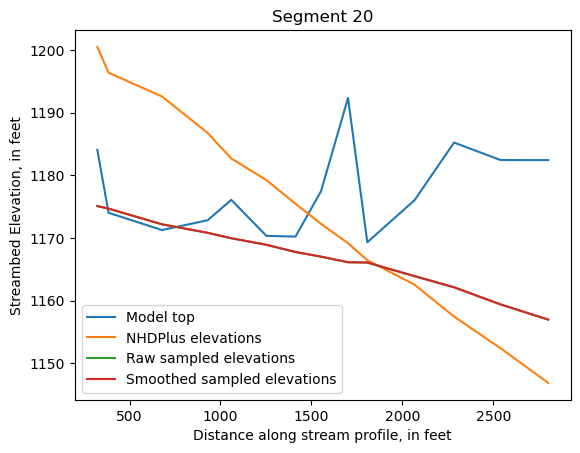
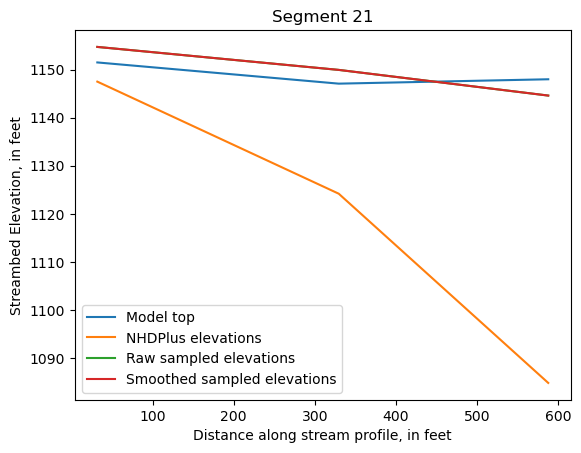
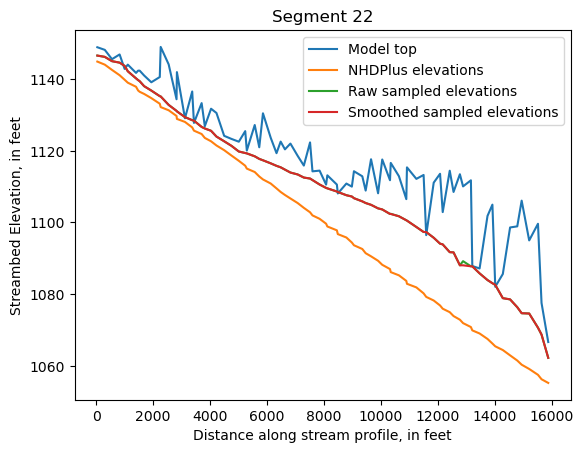
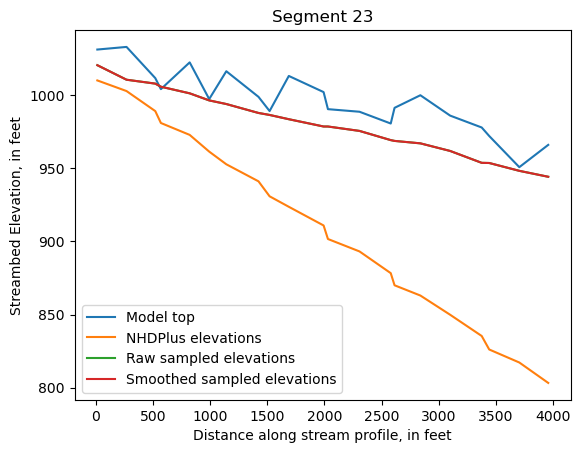
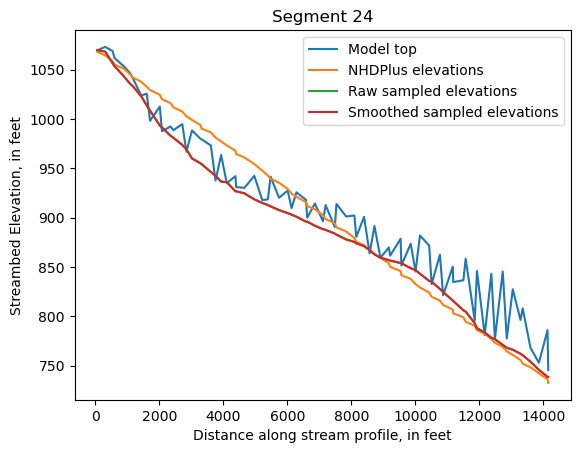
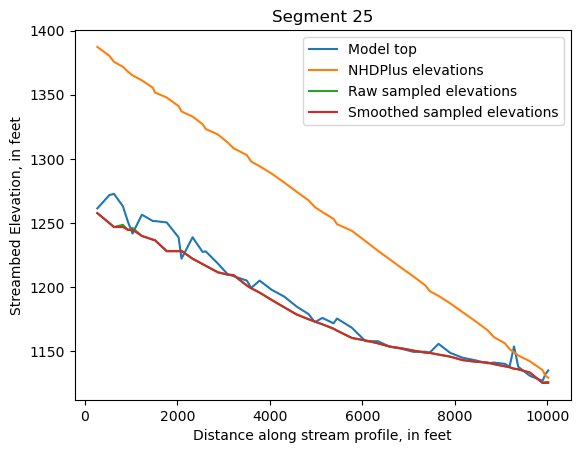
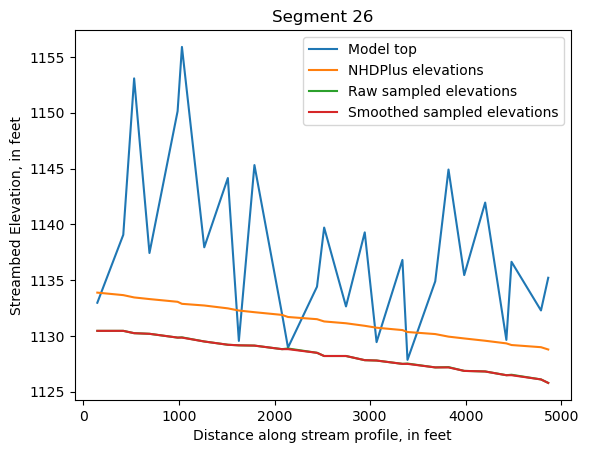
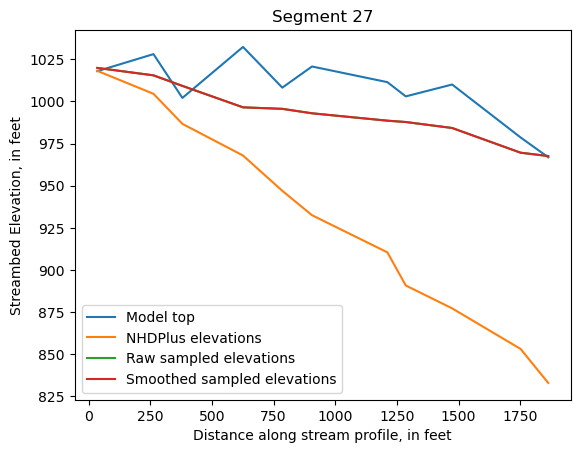
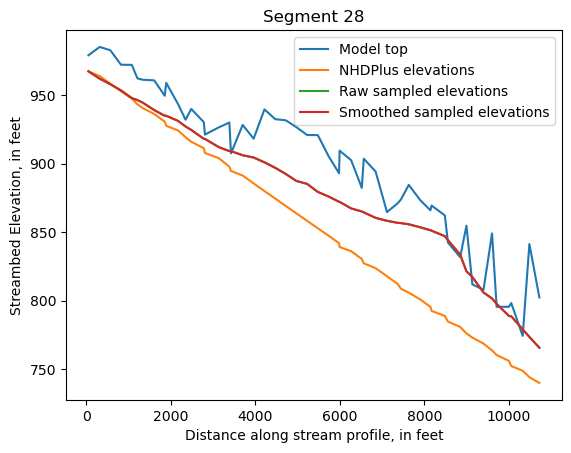
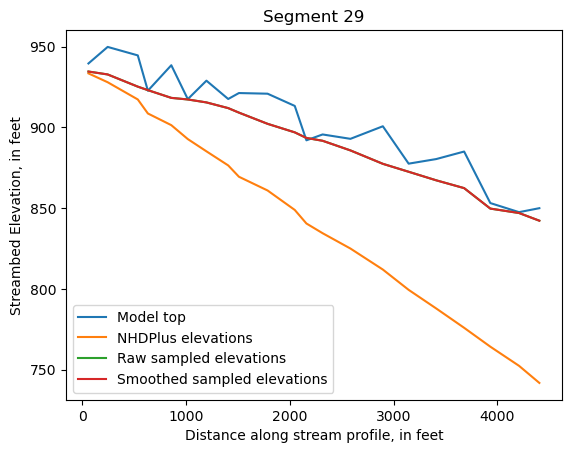
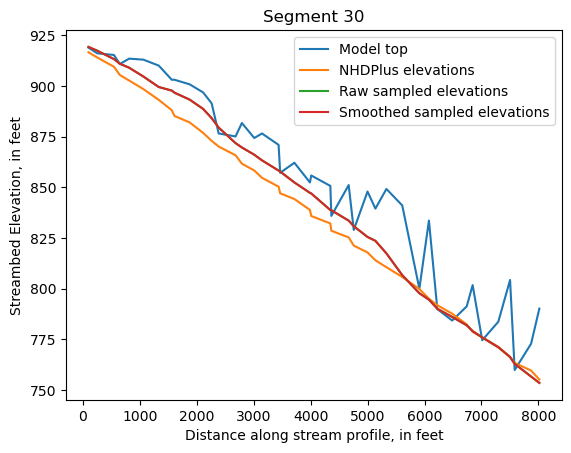
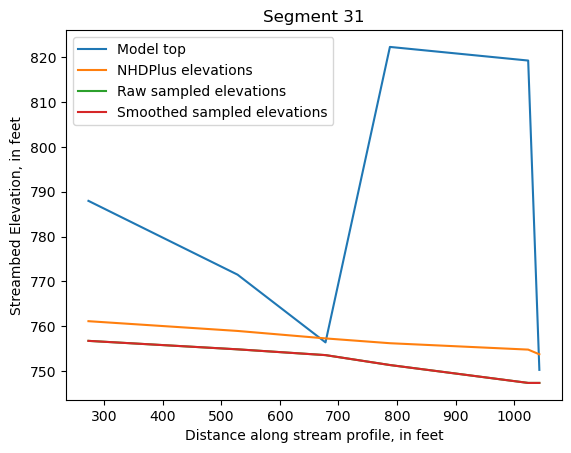
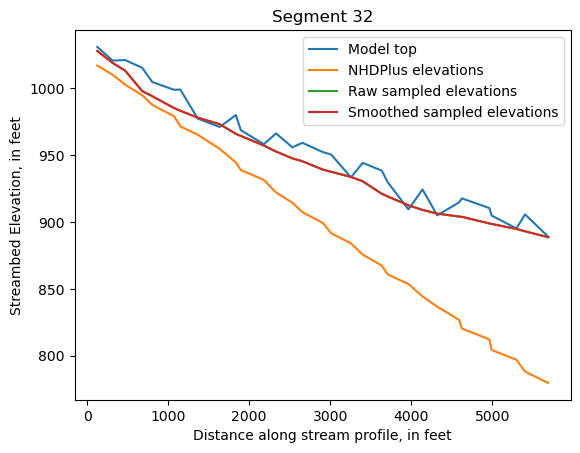
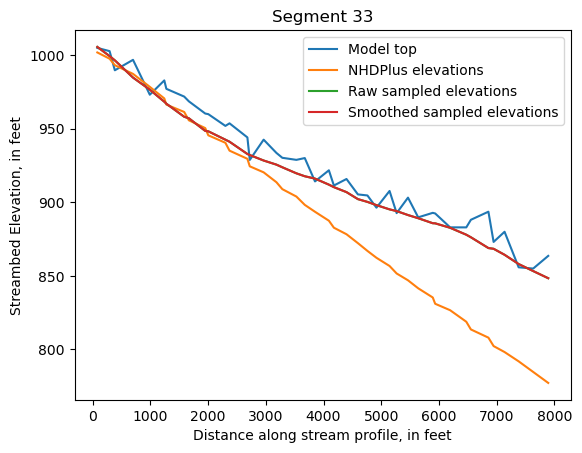
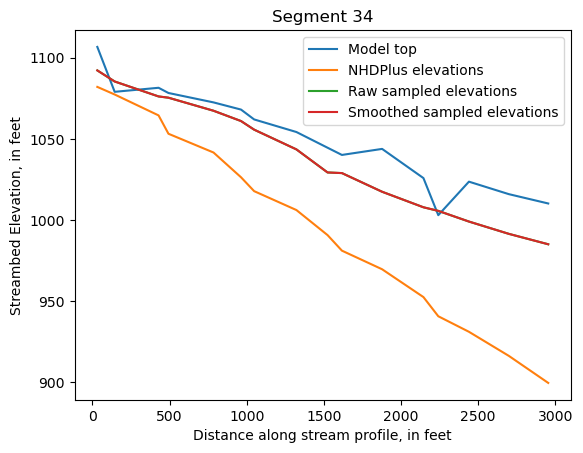
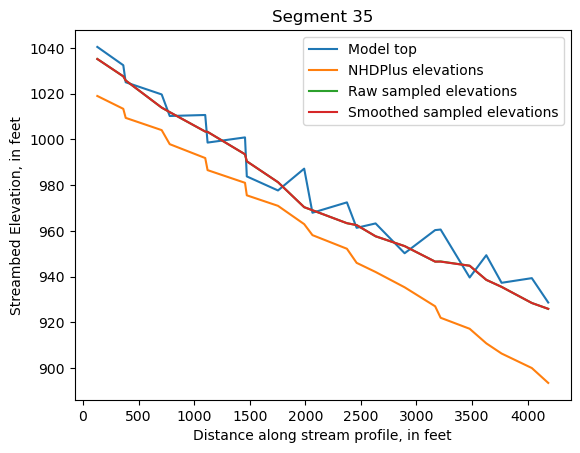
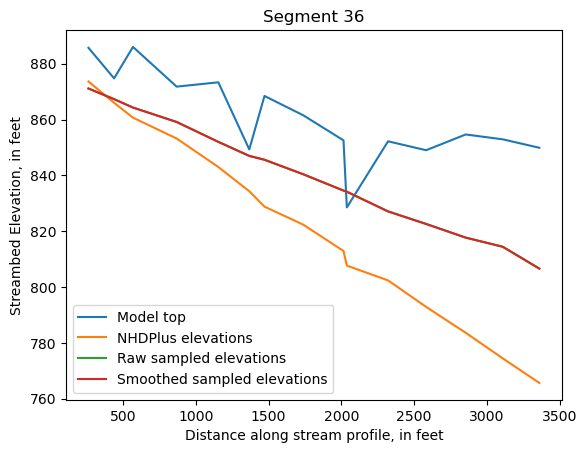
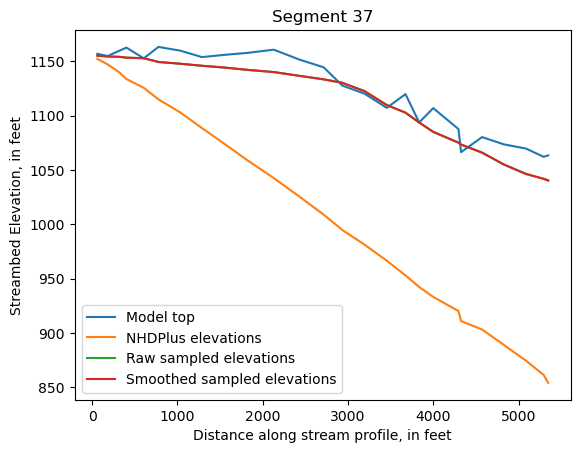
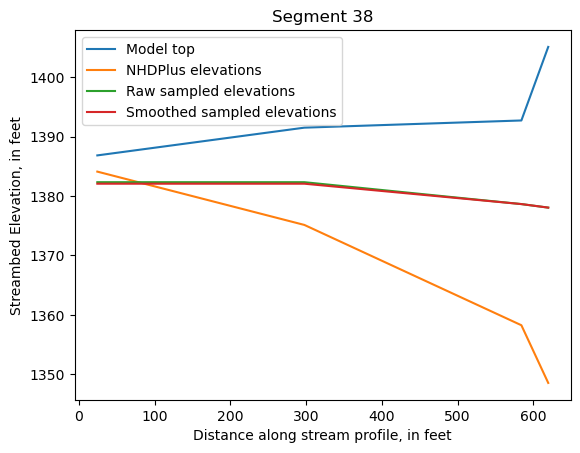
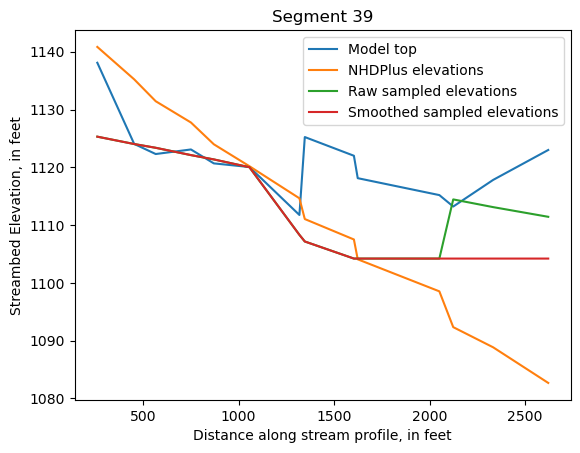
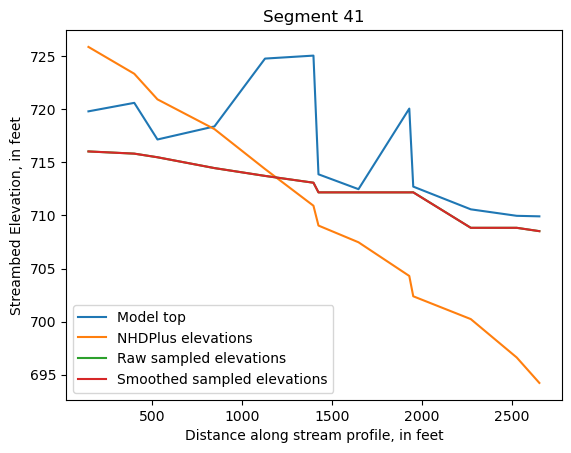
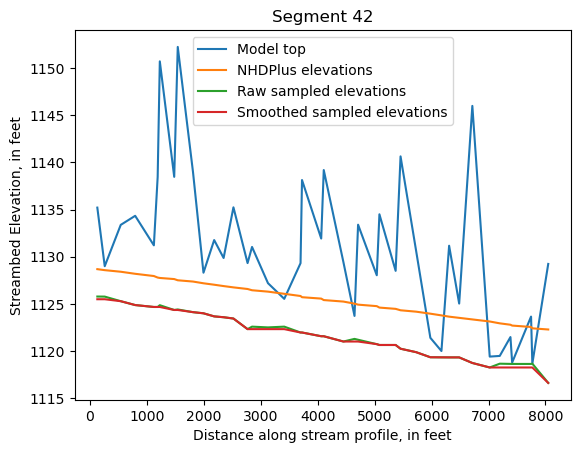
Make comparison plots of the elevations in each segment
Model top: elevations sampled from the DEM at the cell centers
NHDPlus_elevations: reach elevations linearly interpolated from original COMID end elevations in NHDPlus
Raw sampled elevations: minimum DEM elevations within each buffered LineString
Smoothed sampled elevations: minimum DEM elevations within each buffered LineString with smoothing applied
Segment 3 only:
Smoothed sampled with field meas.: Minimum DEM elevations, replaced by any field elevations that were sampled near the reach (determined by intersection with the model cell, or within a
buffer_distance).In the case of segment 3, the additional elevation measurements are lower than the minimum DEM elevations, resulting in lower streambed tops at those points, and continuing downstream until a lower elevation is encountered in the DEM.
Note:
One of the segments has NHDPlus elevations that are much higher than the model top or DEM. This is due to the segment originating outside of the model domain, which means the COMID start elevation from NHDPlus is invalid.
[7]:
dfs = []
segments = sfr.reach_data.groupby('iseg')
for iseg, srd in segments:
    df = srd.copy()
    df['dist'] = srd.rchlen.cumsum()
    df['NHDPlus elevations'] = df.strtop
    dfs.append(df[['i', 'j', 'rno', 'iseg', 'ireach', 'dist', 'NHDPlus elevations']])
df = pd.concat(dfs)
df['Model top'] = sfr.model.dis.top.array[df.i, df.j]
df['Raw sampled elevations'] = [raw_sampled_elevs[rno]
                              for rno in df['rno'].values]
df['Smoothed sampled elevations'] = [smooth_sampled_elevs[rno]
                              for rno in df['rno'].values]
df['Smoothed sampled with field meas.'] = [smooth_elevs_with_field_measurements[rno]
                                           for rno in df['rno'].values]
df['Smoothed sampled elevations'] /= .3048 # convert from meters to feet
df['Raw sampled elevations'] /= .3048
df['Smoothed sampled with field meas.'] /= .3048
[8]:
segments = df.groupby('iseg')
for iseg, srd in segments:
    srd = srd.copy()
    srd.index = srd.dist
    cols = ['Model top', 'NHDPlus elevations', 'Raw sampled elevations', 'Smoothed sampled elevations']
    if iseg == 3:
        cols.append('Smoothed sampled with field meas.')
    ax = srd[cols].plot()
    ax.set_xlabel('Distance along stream profile, in feet')
    ax.set_ylabel('Streambed Elevation, in feet')
    ax.set_title(f"Segment {iseg}")

    # save the profile that begins with segment 1
    if iseg == 1:
        plt.savefig('streambed_elevations_comp.pdf')
[ ]: