The ToxCast database flags concentration-response curves that may be unreliable or inconsistent based on several criteria; however, it is still good practice for the toxEval user to examine the concentration-response curves pertinent their data to assure that results are understood and to gain confidence in the underlying data. At times, the user will find that concentration-response curves for particular chemical-endpoints or for an entire endpoint will need to be excluded from analysis. For chemicals with an extremely large EAR value, concentration-response curves should be examined. Two ways to obtain concentration-response curves are described below (the Comptox Dashboard and the tcpl pipeline).
Comptox Dashboard
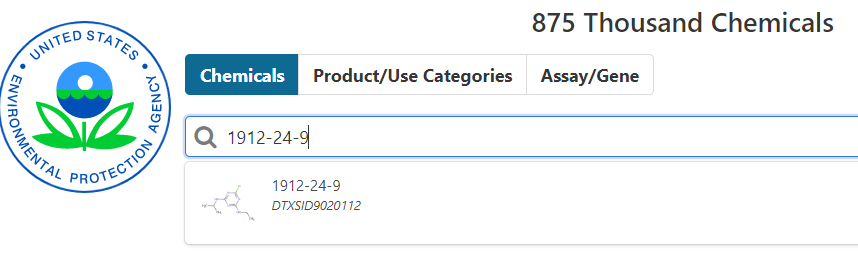
There is a web-based tool, the Comptox Dashboard that
allows you to search for a chemical by systematic name, synonym, CAS
number, DTXSID, or InChIKey. Since we focus on CAS in the
toxEval inputs, let’s explore Atrazine (CAS =
1912-24-9):
Enering the CAS will take you to a page describing properties of the specific chemical. There is a TON of great information there.
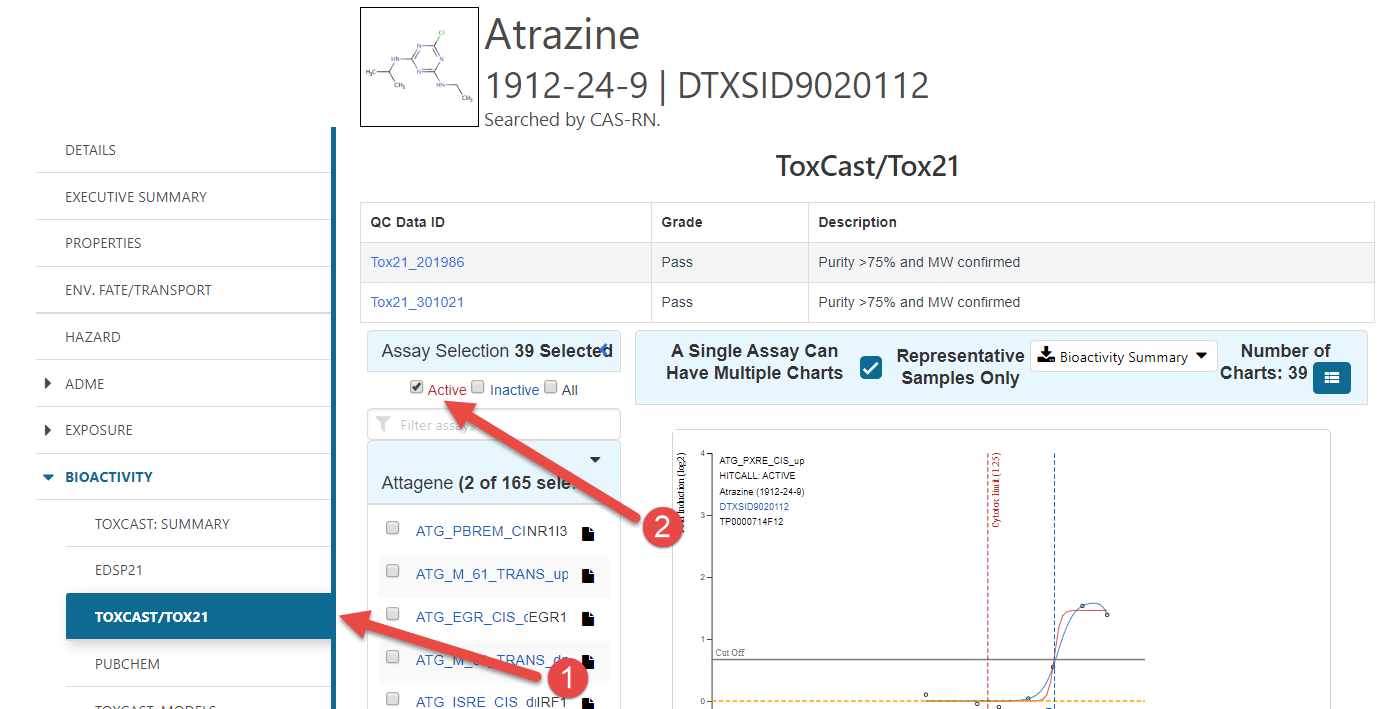
- Click the “Bioactivity” sidebar option, and then the ToxCast/ToxCast21 option.
- Click the “Active” check box to see all of the
concentration-response curves that would be included in
toxEval.
To get to a specific concentration-response curve:
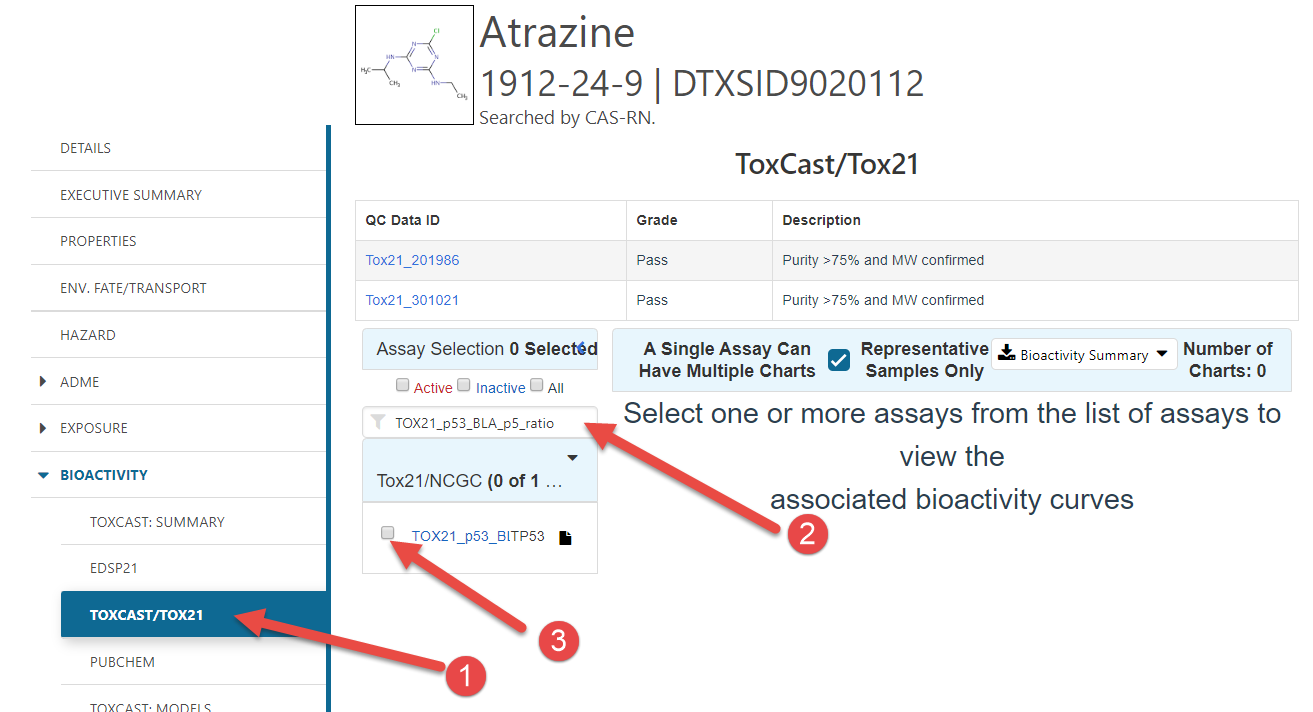
- Click the “Bioactivity” sidebar option, and then the ToxCast/ToxCast21 option.
- Enter the specific endpoint of interest in the search box
- Click the endpoint’s check box
R-package: tcpl
There is another way to locally produce the concentration-response
curves using the tcpl
package. The advantage to this approach is that you can customize
the plots and order of plots. The drawback is that you need to download
a very large MySQL database and have it running locally.
If the database has been downloaded, and MySQL is up-and-running, the following code would produce a single concentration-response curve. Let’s look at Atrazine with the “NVS_ENZ_hPDE4A1” endpoint:
library(tcpl)

tcplConf(drvr = "MySQL",
         user = "my_awesome_username",
         pass = "my_awesome_password",
         host = "localhost",
         db = "database_name")

ep <- "NVS_ENZ_hPDE4A1"
cas <- "1912-24-9"

chem_info <- tcplLoadChem(field = 'casn', val = cas)
assay_info <- tcplLoadAeid(fld = "acnm", val = ep)

mc5 <- tcplLoadData(lvl = 5, type = "mc",
                    fld = c("aeid","spid"),
                    val = list(assay_info$aeid,
                               chem_info$spid))

plot_out <- tcplPlot(lvl = 5,
         fld = c("spid","aeid"), # fields to query on
         val = list(mc5$spid, # sample id's
                    mc5$aeid # assay endpoint id's
                    ),
         by = "aeid", # parameter to divide files
         multi = FALSE, # multiple plots per page - output 6 per page if TRUE
        verbose = TRUE, # output all details if TRUE
        output = "console") # prefix of the filename

plot_out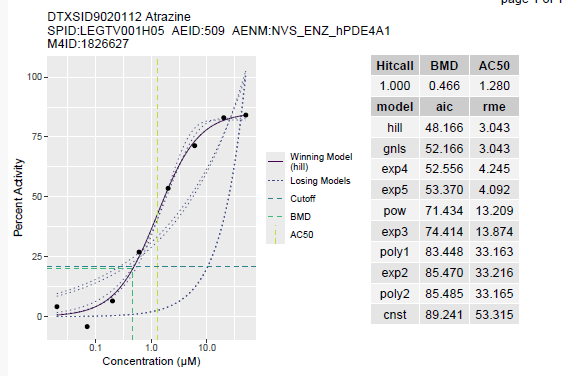
The values passed to the tcplConf function will depend
on how you set up the MySQL database.