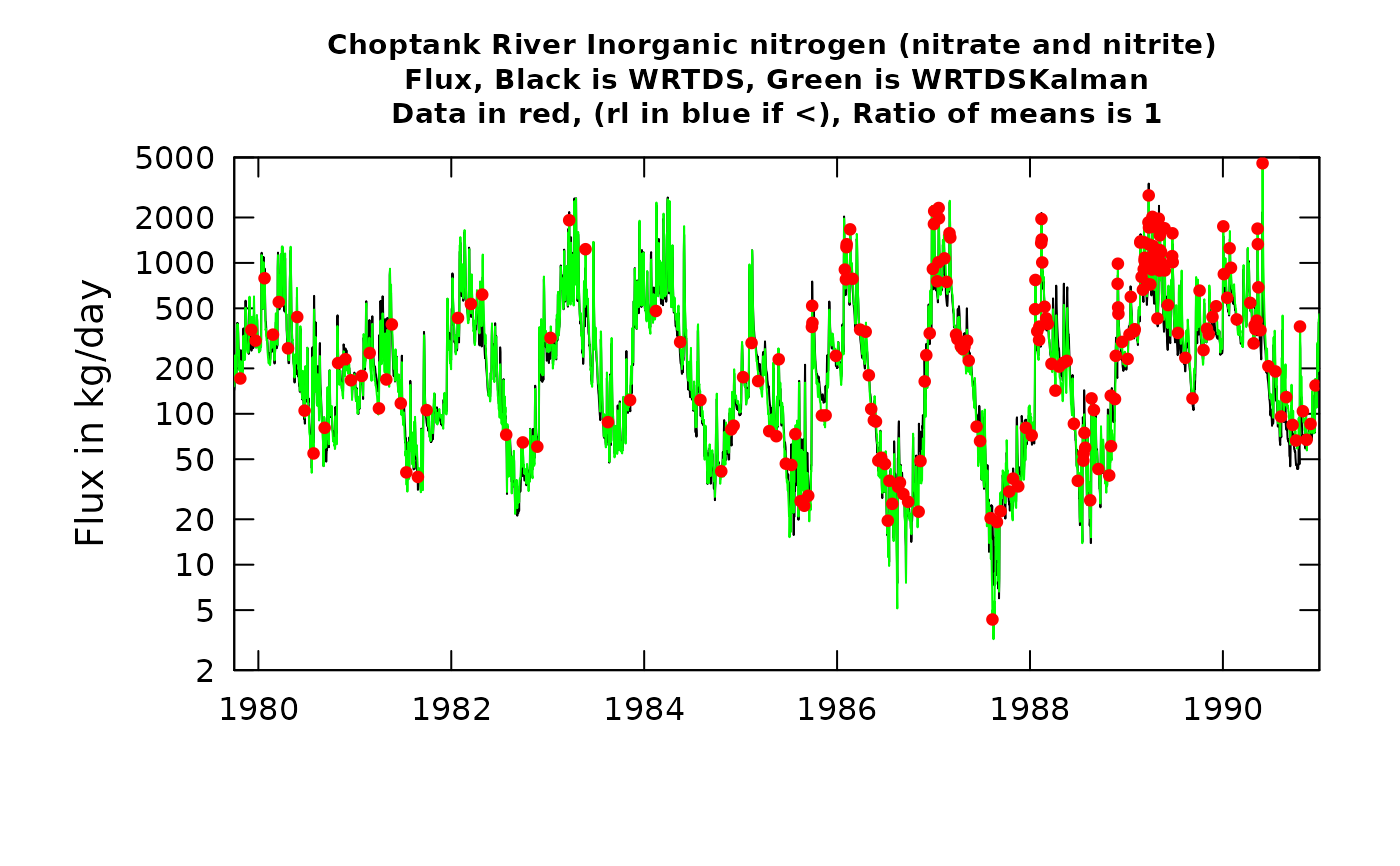
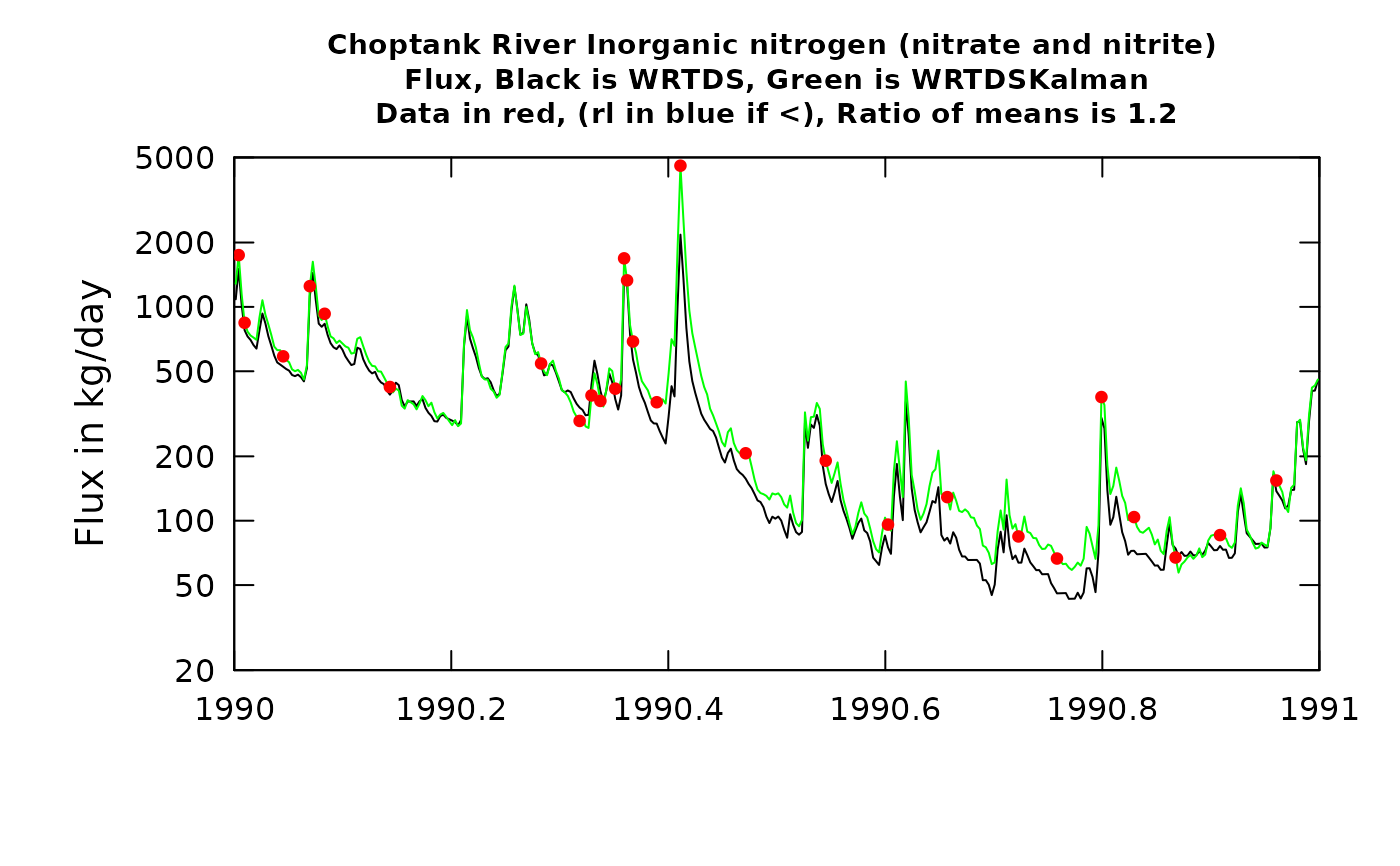
Plot of either concentration or flux over time showing both the WRTDS and WRTDSKalman estimates.
Arguments
- eList
named list with at least the Daily, Sample, and INFO dataframes. This eList must be run through
WRTDSKalman.- start
numeric start of DecYear for plot. If
NA, plot will start at the earliest date in the record.- end
numeric end of DecYear for plot. If
NA, plot will end at the latest date in the record.- conc
logical. If
TRUE, plot concentration, otherwise plot flux.- fluxUnit
number representing entry in pre-defined fluxUnit class array.
printFluxUnitCheatSheet- usgsStyle
logical option to use USGS style guidelines. Setting this option to TRUE does NOT guarantee USGS compliance. It will only change automatically generated labels
Details
In the plot title, Ratio of means is mean of WRTDSKalman estimates to the WRTDS Classic estimates. Ratio only calculated on the data shown in the figure, not the whole series. In the plot, red dots are measured values, blue dots are plotted at the reporting limit for those values that are censored.
Examples
eList <- Choptank_eList
eList <- WRTDSKalman(eList, niter = 10)
#> % complete:
#> 10
#> 20
#> 30
#> 40
#> 50
#> 60
#> 70
#> 80
#> 90
#> 100

plotTimeSlice(eList, start = 1990, end = 1991, conc = TRUE)


plotTimeSlice(eList, start = 1990, end = 1991, conc = FALSE)


plotTimeSlice(eList, start = NA, end = 1991, conc = FALSE)