Using a data frame that has at least Date, Q, Qualifier, populates the rest of the basic Daily data frame used in EGRET analysis.
Usage
populateDaily(rawData, qConvert, verbose = TRUE, adjust = TRUE,
  fill = FALSE, maxgap = 21, fill_type = "interpolation")
Arguments
- rawData
dataframe contains at least Date, Q, Qualifier columns.
- qConvert
numeric conversion to cubic meters per second.
- verbose
logical specifying whether or not to display messages.
- adjust
logical specifying whether or not to add a constant to zero values to allow log transformation. Defaults to TRUE.
- fill
logical specifying whether to fill NA values by linear interpolation. Defaults to FALSE.
- maxgap
Maximum number of NA days allowed for interpolating gaps. Default is 21. Only used if fill is set to TRUE.
- fill_type
character to define what process to fill missing data. Options are "interpolation" - linear interpolation from the `zoo::na.approx`, or "log_interp" - linear interpolation in the log space. Only used if fill is set to TRUE.
Value
A data frame 'Daily' with the following columns:
| Name | Type | Description |
| Q | numeric | Discharge in m^3/s |
| Julian | integer | Number of days since Jan. 1, 1850 |
| Month | integer | Month of the year [1-12] |
| Day | integer | Day of the year [1-366] |
| DecYear | numeric | Decimal year |
| MonthSeq | integer | Number of months since January 1, 1850 |
| Qualifier | character | Qualifying code |
| i | integer | Index of days, starting with 1 |
| LogQ | numeric | Natural logarithm of Q |
| Q7 | numeric | 7 day running average of Q |
| Q30 | numeric | 30 day running average of Q |
Author
Robert M. Hirsch rhirsch@usgs.gov
Examples
Date <- as.character(seq(from = as.Date("2001/1/1"),
to = as.Date("2002/1/2"),
by = "day"))
Q <- c(-1:365)
Qualifier <- rep("",367)
dataInput_complete <- data.frame(Date, Q, Qualifier)
dataInput <- dataInput_complete[-4:-5,]
# No fill, but with 0 and negative:
Daily <- populateDaily(dataInput, qConvert = 1)
#> There are 1 negative flow days.
#> Many EGRET functions will not work with negative values.
#> Adjust is TRUE but there are 1 negative flow days.
#> Discharge was not adjusted.
#> 0.545% missing data.
#> NA ranges in Q (2 total NA values across 1 run):
#> 2001-01-04 to 2001-01-05 (2 days)
#> Many EGRET functions will not work with missing values.
# No negatives/zeros:
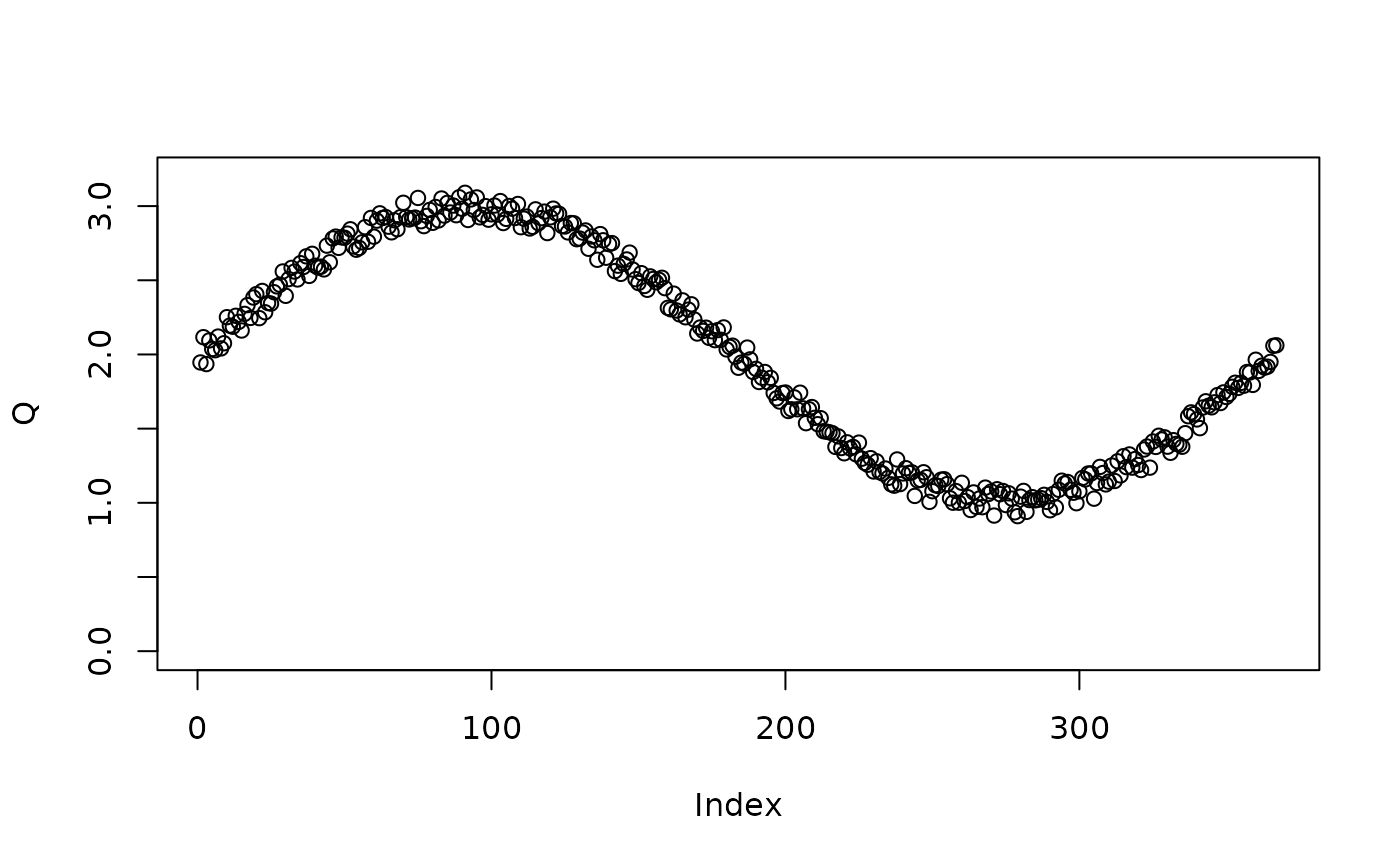
Q <- 2+sin(seq(from = 0, to = 2*pi, length.out = 367))
Q <- jitter(Q, factor = 500)
plot(Q, ylim = c(0, 3.2))
 dataInput_complete <- data.frame(Date, Q, Qualifier)
# Remove some rows to test missing:
dataInput <- dataInput_complete[-4:-5,]
dataInput <- dataInput[-10:-20,]
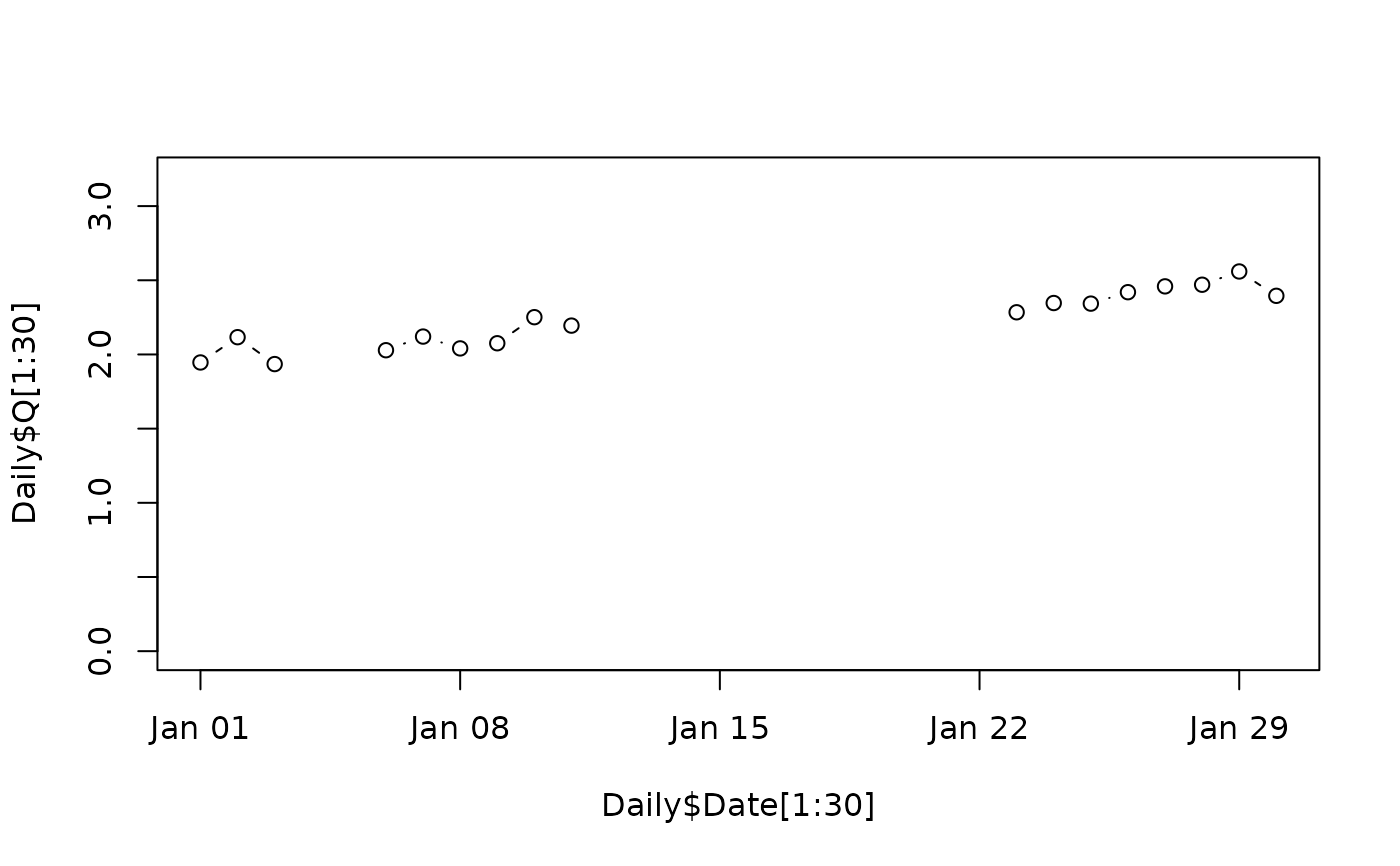
# No fill:
Daily <- populateDaily(dataInput, qConvert = 1)
#> 3.54% missing data.
#> NA ranges in Q (13 total NA values across 2 runs):
#> 2001-01-04 to 2001-01-05 (2 days)
#> 2001-01-12 to 2001-01-22 (11 days)
#> Many EGRET functions will not work with missing values.
plot(Daily$Date[1:30], Daily$Q[1:30], type = "b", ylim = c(0, 3.2))
dataInput_complete <- data.frame(Date, Q, Qualifier)
# Remove some rows to test missing:
dataInput <- dataInput_complete[-4:-5,]
dataInput <- dataInput[-10:-20,]
# No fill:
Daily <- populateDaily(dataInput, qConvert = 1)
#> 3.54% missing data.
#> NA ranges in Q (13 total NA values across 2 runs):
#> 2001-01-04 to 2001-01-05 (2 days)
#> 2001-01-12 to 2001-01-22 (11 days)
#> Many EGRET functions will not work with missing values.
plot(Daily$Date[1:30], Daily$Q[1:30], type = "b", ylim = c(0, 3.2))
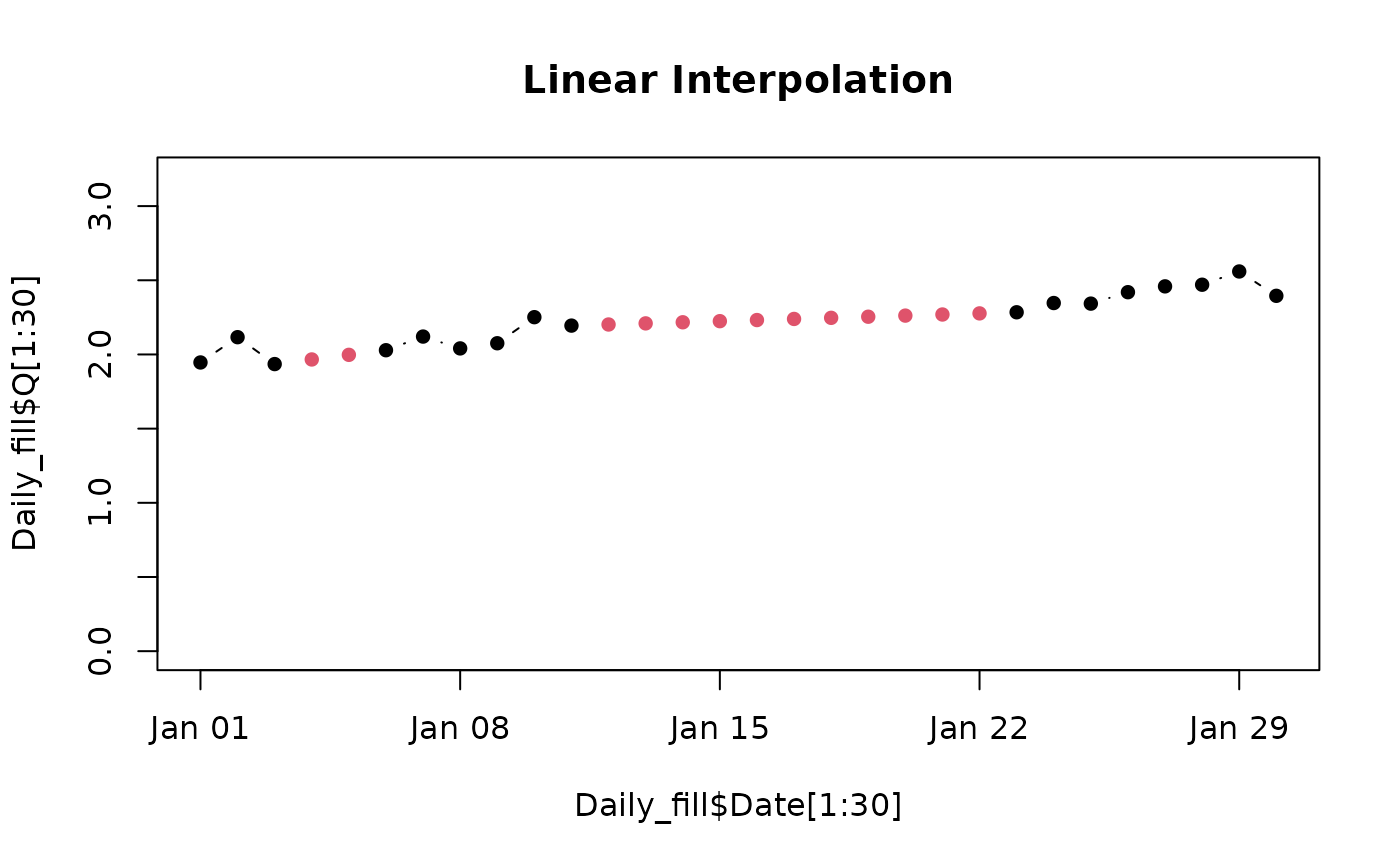
 # Linear interpolation:
Daily_fill <- populateDaily(dataInput,
qConvert = 1,
fill = TRUE,
fill_type = "interpolation")
#> 3.54% missing data.
#> NA ranges in Q (13 total NA values across 2 runs):
#> 2001-01-04 to 2001-01-05 (2 days)
#> 2001-01-12 to 2001-01-22 (11 days)
#> NA values filled by interpolation when gap range less than 21 days.
plot(Daily_fill$Date[1:30],
Daily_fill$Q[1:30],
col = as.factor(Daily_fill$Qualifier[1:30]),
type = "b", pch = 16, ylim = c(0, 3.2),
main = "Linear Interpolation")
# Linear interpolation:
Daily_fill <- populateDaily(dataInput,
qConvert = 1,
fill = TRUE,
fill_type = "interpolation")
#> 3.54% missing data.
#> NA ranges in Q (13 total NA values across 2 runs):
#> 2001-01-04 to 2001-01-05 (2 days)
#> 2001-01-12 to 2001-01-22 (11 days)
#> NA values filled by interpolation when gap range less than 21 days.
plot(Daily_fill$Date[1:30],
Daily_fill$Q[1:30],
col = as.factor(Daily_fill$Qualifier[1:30]),
type = "b", pch = 16, ylim = c(0, 3.2),
main = "Linear Interpolation")
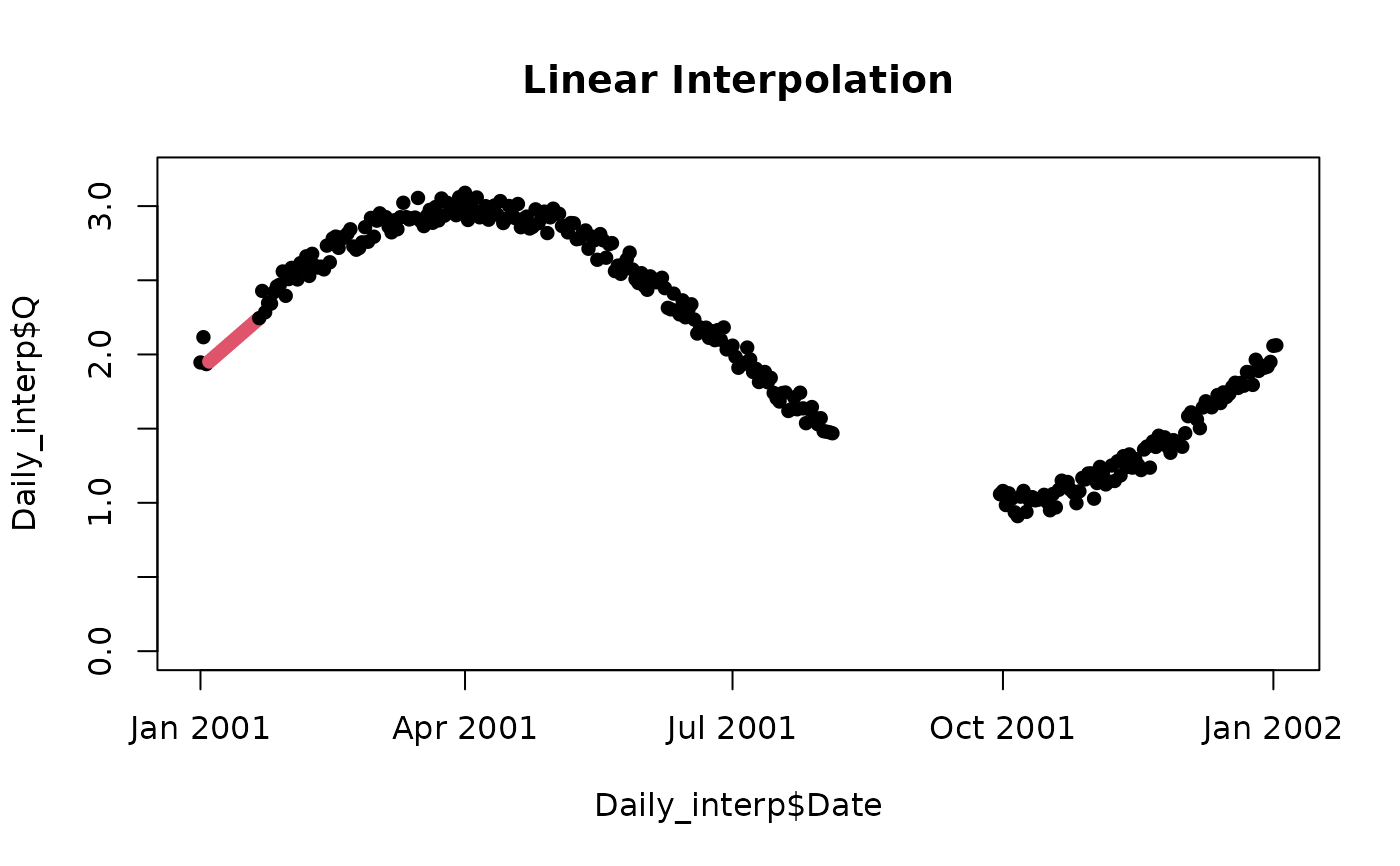
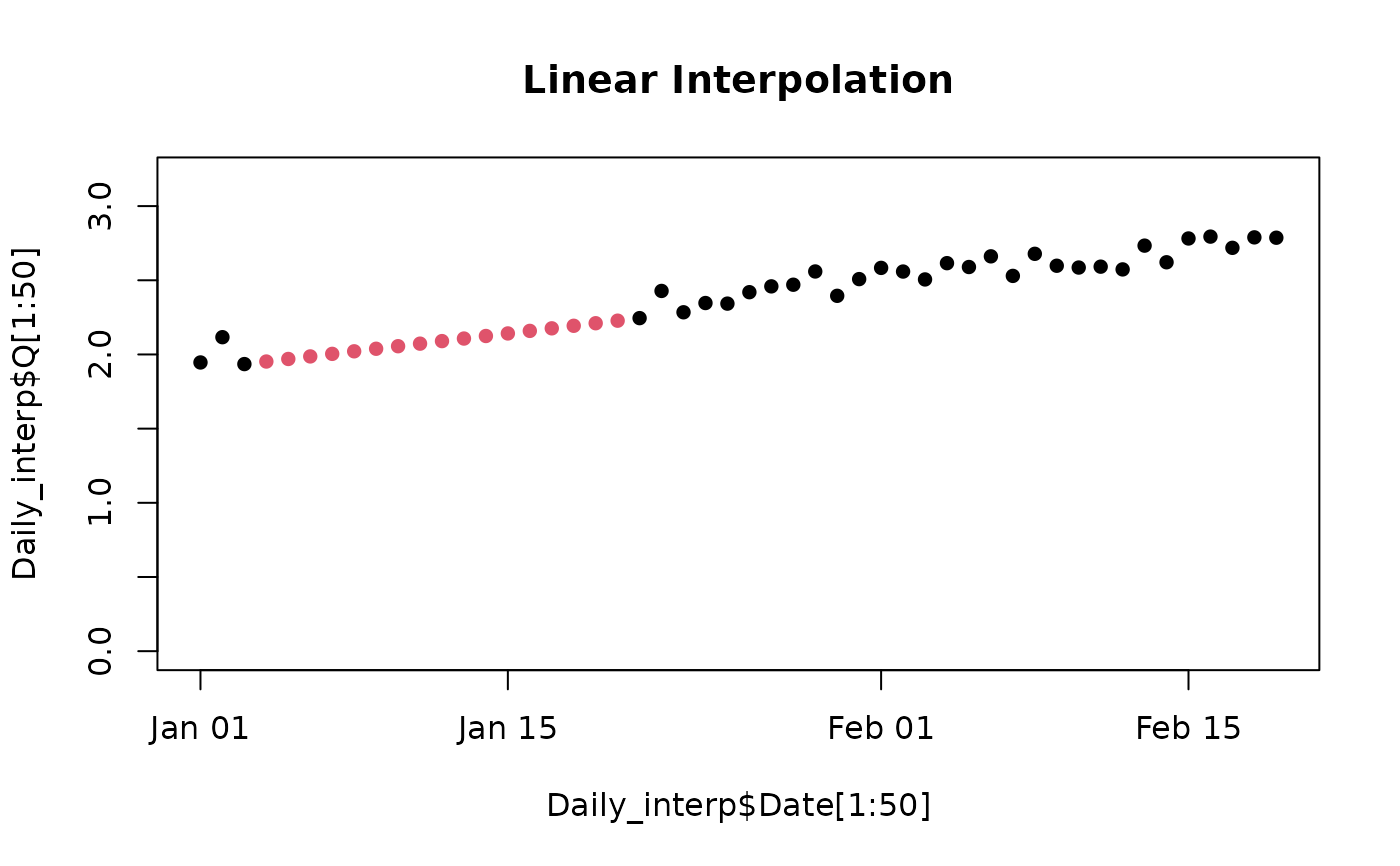
 # Add a gap that is too big do deal with:
dataInput <- dataInput_complete[-4:-20,]
dataInput <- dataInput[-200:-255,]
Daily_interp <- populateDaily(dataInput,
qConvert = 1,
fill = TRUE,
fill_type = "interpolation")
#> 19.9% missing data.
#> NA ranges in Q (73 total NA values across 2 runs):
#> 2001-01-04 to 2001-01-20 (17 days)
#> 2001-08-05 to 2001-09-29 (56 days)
#> NA values filled by interpolation when gap range less than 21 days.
plot(Daily_interp$Date, Daily_interp$Q,
col = as.factor(Daily_interp$Qualifier),
main = "Linear Interpolation",
type = "b", pch = 16, ylim = c(0, 3.2))
# Add a gap that is too big do deal with:
dataInput <- dataInput_complete[-4:-20,]
dataInput <- dataInput[-200:-255,]
Daily_interp <- populateDaily(dataInput,
qConvert = 1,
fill = TRUE,
fill_type = "interpolation")
#> 19.9% missing data.
#> NA ranges in Q (73 total NA values across 2 runs):
#> 2001-01-04 to 2001-01-20 (17 days)
#> 2001-08-05 to 2001-09-29 (56 days)
#> NA values filled by interpolation when gap range less than 21 days.
plot(Daily_interp$Date, Daily_interp$Q,
col = as.factor(Daily_interp$Qualifier),
main = "Linear Interpolation",
type = "b", pch = 16, ylim = c(0, 3.2))
 plot(Daily_interp$Date[1:50], Daily_interp$Q[1:50],
col = as.factor(Daily_interp$Qualifier[1:50]),
main = "Linear Interpolation",
type = "b", pch = 16, ylim = c(0, 3.2))
plot(Daily_interp$Date[1:50], Daily_interp$Q[1:50],
col = as.factor(Daily_interp$Qualifier[1:50]),
main = "Linear Interpolation",
type = "b", pch = 16, ylim = c(0, 3.2))
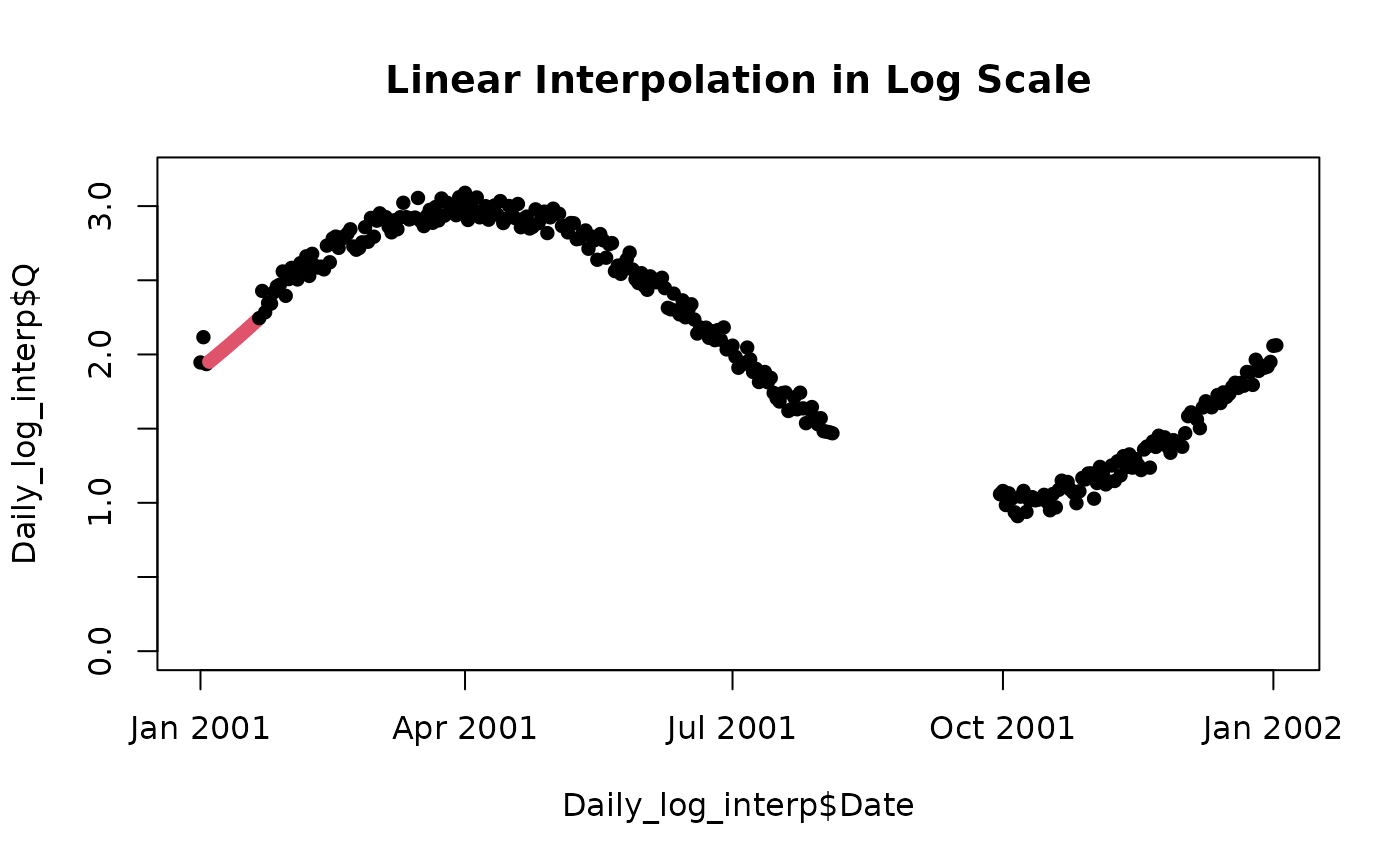
 Daily_log_interp <- populateDaily(dataInput,
qConvert = 1,
fill = TRUE,
fill_type = "log_interp")
#> 19.9% missing data.
#> NA ranges in Q (73 total NA values across 2 runs):
#> 2001-01-04 to 2001-01-20 (17 days)
#> 2001-08-05 to 2001-09-29 (56 days)
#> NA values filled by log_interp when gap range less than 21 days.
plot(Daily_log_interp$Date, Daily_log_interp$Q,
col = as.factor(Daily_log_interp$Qualifier),
main = "Linear Interpolation in Log Scale",
type = "b", pch = 16, ylim = c(0, 3.2))
Daily_log_interp <- populateDaily(dataInput,
qConvert = 1,
fill = TRUE,
fill_type = "log_interp")
#> 19.9% missing data.
#> NA ranges in Q (73 total NA values across 2 runs):
#> 2001-01-04 to 2001-01-20 (17 days)
#> 2001-08-05 to 2001-09-29 (56 days)
#> NA values filled by log_interp when gap range less than 21 days.
plot(Daily_log_interp$Date, Daily_log_interp$Q,
col = as.factor(Daily_log_interp$Qualifier),
main = "Linear Interpolation in Log Scale",
type = "b", pch = 16, ylim = c(0, 3.2))
 plot(Daily_log_interp$Date[1:50], Daily_log_interp$Q[1:50],
col = as.factor(Daily_log_interp$Qualifier[1:50]),
main = "Linear Interpolation in Log Scale",
type = "b", pch = 16, ylim = c(0, 3.2))
plot(Daily_log_interp$Date[1:50], Daily_log_interp$Q[1:50],
col = as.factor(Daily_log_interp$Qualifier[1:50]),
main = "Linear Interpolation in Log Scale",
type = "b", pch = 16, ylim = c(0, 3.2))
 # Real data:
eList <- Choptank_eList
Daily_chop <- eList$Daily
df <- Daily_chop[,c("Date", "Q")]
df <- df[-2:-5, ]
df <- df[-100:-200,]
D2 <- populateDaily(df, 1, fill = TRUE)
#> 0.898% missing data.
#> NA ranges in Q (105 total NA values across 2 runs):
#> 1979-10-02 to 1979-10-05 (4 days)
#> 1980-01-12 to 1980-04-21 (101 days)
#> NA values filled by interpolation when gap range less than 21 days.
plot(D2$Date[1:20], D2$Q[1:20],
col = as.factor(D2$Qualifier[1:20]),
main = "Linear Interpolation",
type = "b", pch = 16)
# Real data:
eList <- Choptank_eList
Daily_chop <- eList$Daily
df <- Daily_chop[,c("Date", "Q")]
df <- df[-2:-5, ]
df <- df[-100:-200,]
D2 <- populateDaily(df, 1, fill = TRUE)
#> 0.898% missing data.
#> NA ranges in Q (105 total NA values across 2 runs):
#> 1979-10-02 to 1979-10-05 (4 days)
#> 1980-01-12 to 1980-04-21 (101 days)
#> NA values filled by interpolation when gap range less than 21 days.
plot(D2$Date[1:20], D2$Q[1:20],
col = as.factor(D2$Qualifier[1:20]),
main = "Linear Interpolation",
type = "b", pch = 16)
 plot(D2$Date[1:110], D2$Q[1:110],
col = as.factor(D2$Qualifier[1:110]),
main = "Linear Interpolation",
type = "b", pch = 16)
plot(D2$Date[1:110], D2$Q[1:110],
col = as.factor(D2$Qualifier[1:110]),
main = "Linear Interpolation",
type = "b", pch = 16)