Introduction to EGRET Confidence Intervals
Robert M. Hirsch, Laura A. De Cicco
04 April, 2025
Source:vignettes/EGRETci.Rmd
EGRETci.RmdIntroduction
This package EGRETci implements a set of approaches to the analysis of uncertainty associated with WRTDS trend analysis as implemented in the EGRET package. The various functions included here are all discussed in the A bootstrap method for estimating uncertainty of water quality trends Hirsch, Archfield, and De Cicco, 2015
The EGRETci package is designed for interactive or batch use. Instructions for both are included here in the vignette. The package allows users to set the Period of Analysis, and various smoothing parameters for WRTDS. Users should consult the EGRET vignette for more background on those issues. For more extensive documentation refer to EGRETci
The EGRETci package is designed to carry out four types of tasks.
Evaluate a water quality trend over a specific span of years and produce a variety of tabular results. This is done with a short workflow involving the functions:
runPairBootorrunGroupBoot. The results come in three forms: 1) console output, which shows the bootstrap replicate process as it is underway and the results when it has finished, and a set of outputs in a named list called eBoot. The contents of eBoot are described below.Plot histograms of values for the trend magnitudes, expressed in percent change over the specified period, for flow-normalized concentration and flow-normalized flux. This is done with the function
plotHistogramTrend. It depends on outputs contained in eBoot. Note that there are a number of custom outputs similar to these histograms that can be developed from the contents of eBoot (for example, what is the likelihood that the flow normalized flux decreased by more than 2000 kg/year over the trend period). Such analyses would require a small amount of script writing by the user.Plot confidence bands around the computed trends in flow-normalized concentration and flow-normalized flux. This is done using a function called
ciCalculationsand then, using the output from that function running two functions that produce the confidence band graphics for concentration and flux respectively (plotConcHistBoot, andplotFluxHistBoot).Create prediction intervals around estimated concentration or flux values for specific days, months, or years. The estimates of interest here are the WRTDS_K. A detailed description of how these estimates can be made is provided in the vignette on WRTDS Kalman Prediction Intervals.
Required Data Frames
The following table provides definitions of the four data frames that constitute the named list eBoot
| Data Frame | Column | Definition |
|---|---|---|
| bootOut | rejectC | Reject Ho, (no trend in concentration), TRUE or FALSE |
| pValC | two-sided p-value for no trend in concentration | |
| estC | standard WRTDS estimate of change from starting year to ending year in mg/L | |
| lowC90 | Lower confidence limit (90%) on concentration trend | |
| upC90 | Upper confidence limit (90%) on concentration trend | |
| lowC50 | Lower confidence limit (50%) on concentration trend | |
| upC50 | Upper confidence limit (50%) on concentration trend | |
| lowC95 | Lower confidence limit (95%) on concentration trend | |
| upC95 | Upper confidence limit (95%) on concentration trend | |
| likeCUp | Likelihood that trend in concentration is upwards | |
| likeCDown | Likelihood that trend in concentration is downwards | |
| rejectF | Reject Ho, (no trend in flux), TRUE or FALSE | |
| pValF | two-sided p-value for no trend in flux | |
| estF | estimate of change from starting year to ending year, in 106 kg/yr | |
| lowF90 | Lower confidence limit (90%) on flux trend | |
| upF90 | Upper confidence limit (90%) on flux trend | |
| lowF50 | Lower confidence limit (50%) on flux trend | |
| upF50 | Upper confidence limit (50%) on flux trend | |
| lowF95 | Lower confidence limit (95%) on flux trend | |
| upF95 | Upper confidence limit (95%) on flux trend | |
| likeFUp | Likelihood that trend in flux is upwards | |
| likeFDown | Likelihood that trend in flux is downwards | |
| baseConc | Estimated mean flow-normalized concentration for first year, in mg/L | |
| baseFlux | Estimated mean flow-normalized flux for start year, in 106 kg/yr | |
| iBoot | The actual number of bootstrap replicates used | |
| wordsOut | a vector of four character variables (self explanatory) | |
| xConc | a vector of length iBoot, of the change in flow normalized concentration computed by each bootstrap replicate (mg/L) | |
| xFlux | a vector of length iBoot, of the change in flow normalized flux computed by each bootstrap replicate (106 kg/yr) | |
| pConc | a vector of length iBoot, of the change in flow normalized concentration computed from each bootstrap replicate expressed as % change | |
| pFlux | a vector of length iBoot, of the change in flow normalized flux computed from each bootstrap replicate expressed as % change |
WRTDS Bootstrap Test
The WBT (WRTDS Bootstrap Test) can be run interactively or in batch.
Regardless of which approach is used, if the user wishes to use any non-default values of the parameters for model estimation or period of analysis these need to be set up before running the code. For example:
If the period of analysis is to be anything other than a Water Year
(paStart=10, paLong=12), the user must use the setPA
function. For example if we want to do the analysis for the three months
starting with April, the command would be
eList <- setPA(eList, paStart = 4, paLong = 3).
If the desired value of windowY was 10 rather than the default value
of 7, then the command needed would be
eList$INFO$windowY <- 10, similar commands can be used
for windowQ, windowS, minNumObs, minNumUncen and edgeAdjust (see help
page for modelEstimation in the EGRET
package).
Once all of the parameters have been set (which requires no action by the user if the defaults are to be used) the set of commands to do a pairs analysis are:
library(EGRET)
library(EGRETci)
eList <- Choptank_eList

year1 <- 1985
year2 <- 2009

pairOut <- EGRET::runPairs(eList,
                             year1, year2,
                             windowSide = 7)

# For good analysis, set nBoot to about 100
# For a quick check that things are working, set it much lower:
boot_pair_out <- runPairsBoot(eList, pairOut, nBoot = 100)
The output looks like this:
   Choptank River
   Inorganic nitrogen (nitrate and nitrite)
   Water Year

 Change estimates are for  2009  minus  1985

Should we reject Ho that Flow Normalized Concentration Trend = 0 ? Reject Ho
 best estimate of change in concentration is   0.377 mg/L
  Lower and Upper 90% CIs 0.2748546 0.4383584
 also 95% CIs 0.2517219 0.4588038
 and 50% CIs 0.3360355 0.4079827
 approximate two-sided p-value for Conc      0.02
* Note p-value should be considered to be < stated value
 Likelihood that Flow Normalized Concentration is trending up = 0.995  is trending down = 0.00495
* Note p-value should be considered to be < stated value

Should we reject Ho that Flow Normalized Flux Trend = 0 ? Reject Ho
 best estimate of change in flux is   0.0538 10^6 kg/year
  Lower and Upper 90% CIs 0.0367071 0.06235301
 also 95% CIs 0.03299696 0.0635553
 and 50% CIs 0.04764486 0.05776485
 approximate two-sided p-value for Flux      0.02
* Note p-value should be considered to be < stated value
 Likelihood that Flow Normalized Flux is trending up = 0.995  is trending down = 0.00495

 Upward trend in concentration is highly likely
 Upward trend in flux is highly likely
 Downward trend in concentration is highly unlikely
 Downward trend in flux is highly unlikely
Let’s run another example, where we assume that we want use the example data set Choptank_eList and have a PA of December, January, February and March, that we wanted to set windowY = 10 and minNumObs = 50, and all other smoothing parameters at their default values. And we want to run the trend analysis for 1990 to 2011, use a maximum of 50 replicates, and a block length of 200. The script would be:
library(EGRET)
library(EGRETci)
eList <- Choptank_eList
eList <- setPA(eList, paStart = 12, paLong = 4)
eList$INFO$windowY <- 10
eList$INFO$minNumObs <- 50

year1 <- 1990
year2 <- 2011

pairOut <- EGRET::runPairs(eList,
                             year1, year2,
                             windowSide = 7)
##
## Choptank River
## Inorganic nitrogen (nitrate and nitrite)
## Season Consisting of Dec Jan Feb Mar
##
## Change estimates 2011 minus 1990
##
## For concentration: total change is 0.175 mg/L
## expressed as Percent Change is +13.29 %
##
## Concentration v. Q Trend Component +15.36 %
## Q Trend Component -2.08 %
##
##
## For flux: total change is 0.0276 million kg/year
## expressed as Percent Change is +12.56 %
##
## Concentration v. Q Trend Component +6.77 %
## Q Trend Component +5.79 %
##
## TotalChange CQTC QTC x10 x11 x20 x22
## Conc 0.175 0.203 -0.027 1.32 1.32 1.52 1.50
## Flux 0.028 0.015 0.013 0.22 0.22 0.23 0.25
boot_pair_out <- runPairsBoot(eList, pairOut, nBoot = 50)##
## Choptank River
## Inorganic nitrogen (nitrate and nitrite)
## Season Consisting of Dec Jan Feb Mar
##
## Change estimates are for 2011 minus 1990
##
## Should we reject Ho that Flow Normalized Concentration Trend = 0 ? Do Not Reject Ho
## best estimate of change in concentration is 0.175 mg/L
## Lower and Upper 90% CIs -0.1041711 0.2976591
## also 95% CIs -0.1658517 0.3008164
## and 50% CIs 0.08048021 0.2408267
## approximate two-sided p-value for Conc 0.28
## Likelihood that Flow Normalized Concentration is trending up = 0.853 is trending down = 0.147
##
## Should we reject Ho that Flow Normalized Flux Trend = 0 ? Do Not Reject Ho
## best estimate of change in flux is 0.0276 10^6 kg/year
## Lower and Upper 90% CIs -0.01300083 0.04795364
## also 95% CIs -0.03004896 0.05121886
## and 50% CIs 0.00558965 0.03765054
## approximate two-sided p-value for Flux 0.34
## Likelihood that Flow Normalized Flux is trending up = 0.833 is trending down = 0.167
##
## Upward trend in concentration is likely
## Upward trend in flux is likely
## Downward trend in concentration is unlikely
## Downward trend in flux is unlikelyHistograms
The function plotHistogramTrend plots a histogram of all
of the trend magnitudes (expressed in percentage change over the
selected period) from the full set of replicates created by
runPairsBoot or runGroupsBoot. These
magnitudes are stored in the eBoot list. These histograms serve the
purpose of providing a graphical impression of the central tendency and
the uncertainty about the size of a trend. They can be used to help
answer questions like: “How sure are we that the trend is positive?” or
“How sure are we that the decrease is at least a 20% decrease over the
period of interest?” The plotHistogramTrend function can
produce histograms either for Flow Normalized Concentration or for Flow
Normalized Flux.
When creating a histogram it is important to carefully determine what “bins” to use. In this plot it is a good idea to make sure that the plot covers a range of both negative and positive values even though it might be the case that the entire range of the trend magnitudes is positive (or negative). The function is set up so that it defaults to setting up 10 bins and the bins are set to cover the full range of the magnitudes and at least cover magnitudes as low as -10% and as high as +10%. The bins are set up based on a minimum value (xMin), a maximum value (xMax), and a step size (xStep). The defaults used in an initial run can simply leave out these three arguments and will produce a plot. This first plot would not be suitable for publication or display, but is intended to guide the analyst to set these three arguments to produce a suitable plot.
Ultimately we want a plot with these characteristics: The value of
xStep should be an integer such as 5, 10, or 20 so the width of the bins
is 5%, 10% or 20%. xStep should be small enough so that the histogram
looks relatively smooth. If it is too small the histogram bars will tend
to be irregular. xStep should not be so large that there is poor
resolution of the shape of the distribution. If a very smooth histogram
is desired then the analyst needs to have run the
runPairsBoot function with a high number of replicates (say
nBoot = 200). The value of xStep should be less than the
minimum value observed in the set of bootstrap replicates. xMin should
be some negative integer multiple of step size. If no values were
negative, then setting it at -1 times xStep would be a good choice. xMax
should be larger than the maximum value in the set of bootstrap
replicates and should be some positive integer multiple of xStep. If
there are no positive values then 1 times xStep would be a good
choice.
Note that the plots always show a vertical solid line at 0% trend, simply as a point of reference for the “no trend” result. They also show a dashed vertical line at the value of the ordinary WRTDS estimate of the trend magnitude in percent. This vertical line fall near the median value for all the bootstrap replicates.
This initial run will give the analyst the basic information needed to set up a good set of values for xMin, xMax and xStep.
library(EGRET)
library(EGRETci)

#Concentration an initial run:
plotHistogramTrend(eList = eList, eBoot = boot_pair_out,
                   xMin = -15, xMax = 35, xStep = 5)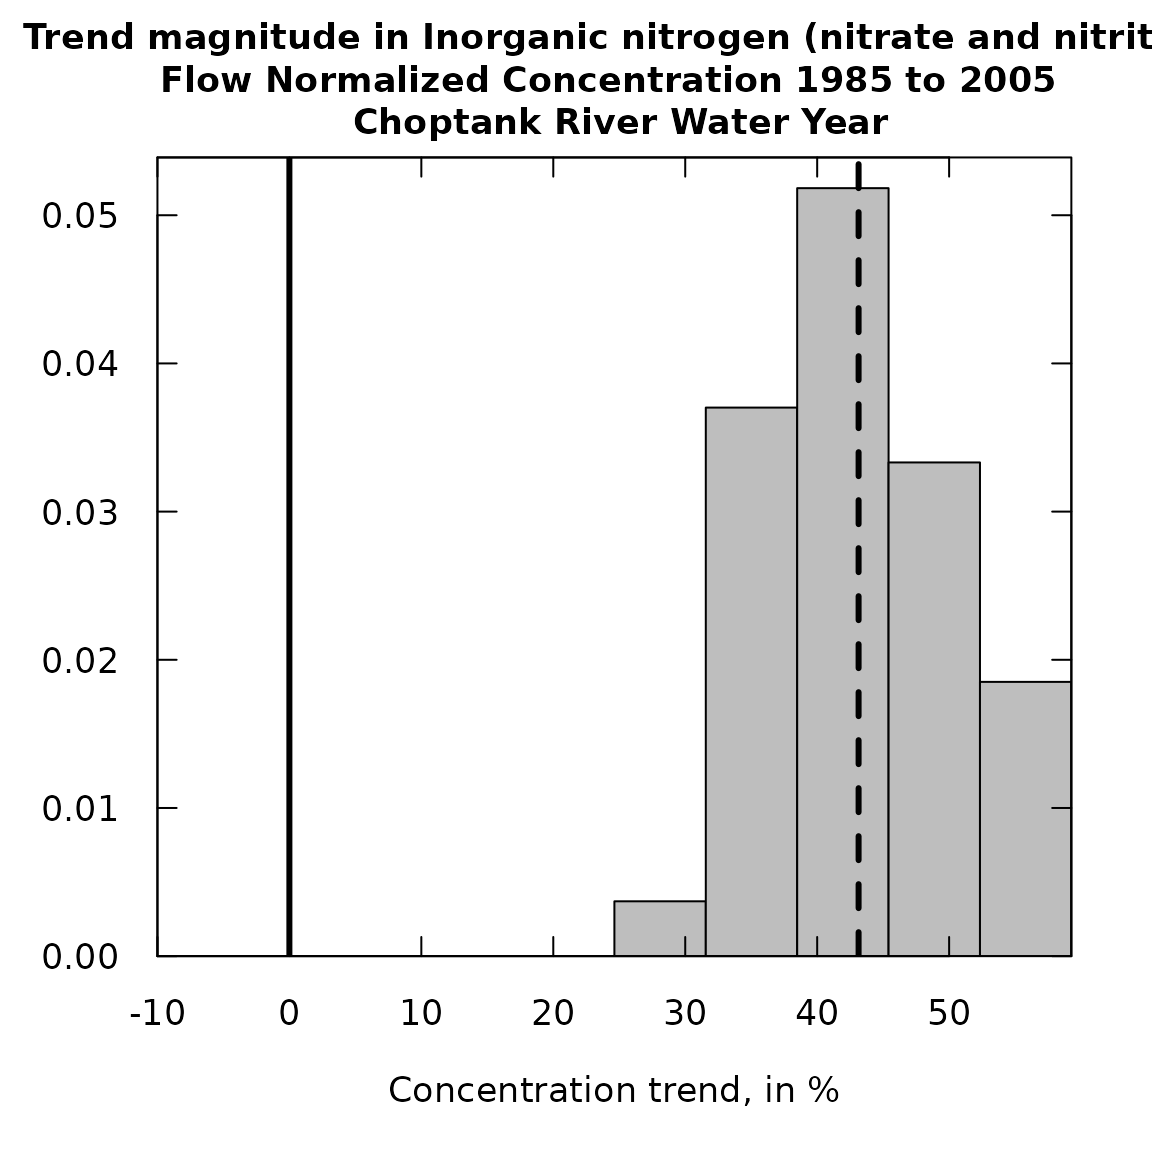
#Flux an initial run:
plotHistogramTrend(eList = eList, eBoot = boot_pair_out,
                   xMin = -15, xMax = 35, xStep = 5,
                   flux = TRUE)
Having seen these initial versions of the plot one can run the functions again with a set of arguments that will produce a plot that is suitable for presentation or publication.
Alternatively, the two plots can be shown side-by-side using a
workflow. Use the par function to set up both functions to
plot side-by-side:
par(mfrow=c(1,2))
#Concentration, presentation version:
plotHistogramTrend(eList = eList, eBoot = boot_pair_out,
                   xMin = -15, xMax = 35, xStep = 5,
                   flux = FALSE)

#Flux, presentation version:
plotHistogramTrend(eList = eList, eBoot = boot_pair_out,
                   xMin = -15, xMax = 35, xStep = 5,
                   flux = TRUE)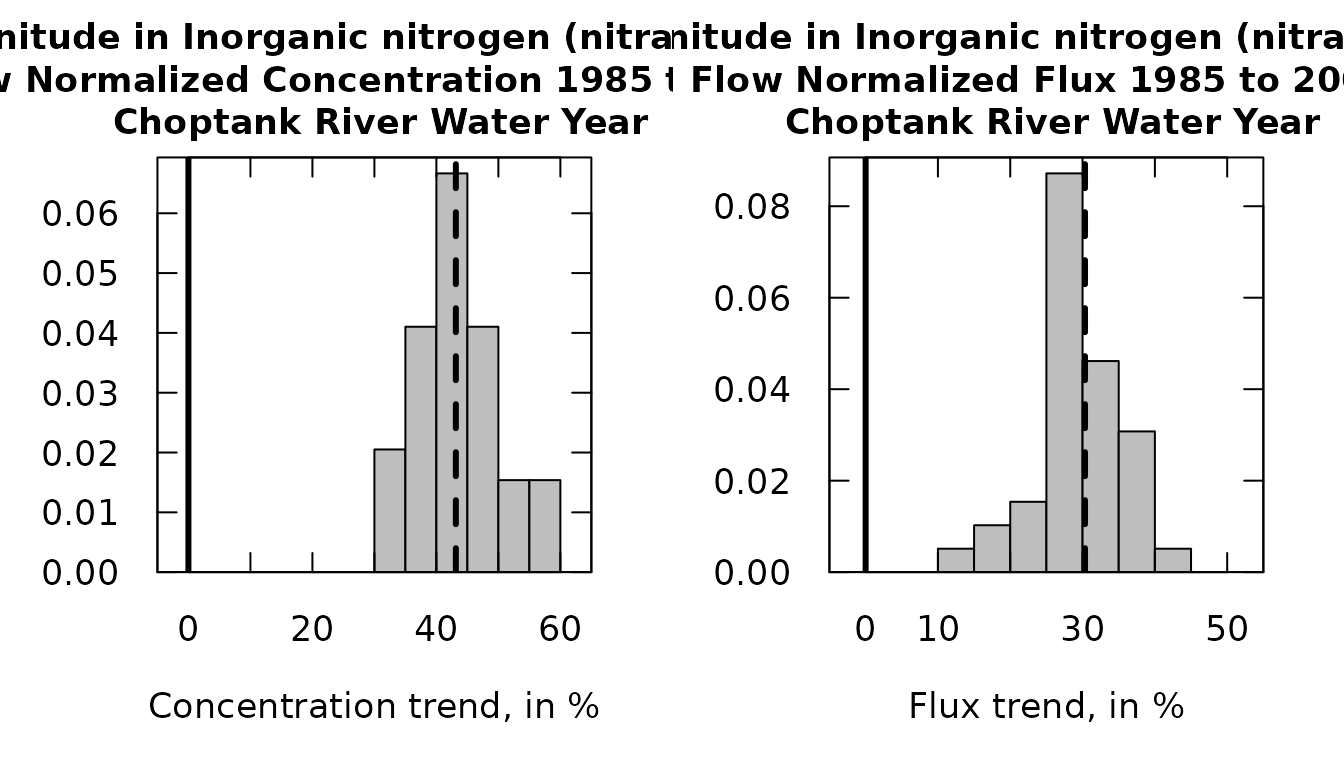
Or:
par(mfrow=c(2,1))
#Concentration, presentation version:
plotHistogramTrend(eList = eList, eBoot = boot_pair_out,
                   xMin = -15, xMax = 35, xStep = 5,
                   flux = FALSE)

#Flux, presentation version:
plotHistogramTrend(eList = eList, eBoot = boot_pair_out,
                   xMin = -15, xMax = 35, xStep = 5,
                   flux = TRUE)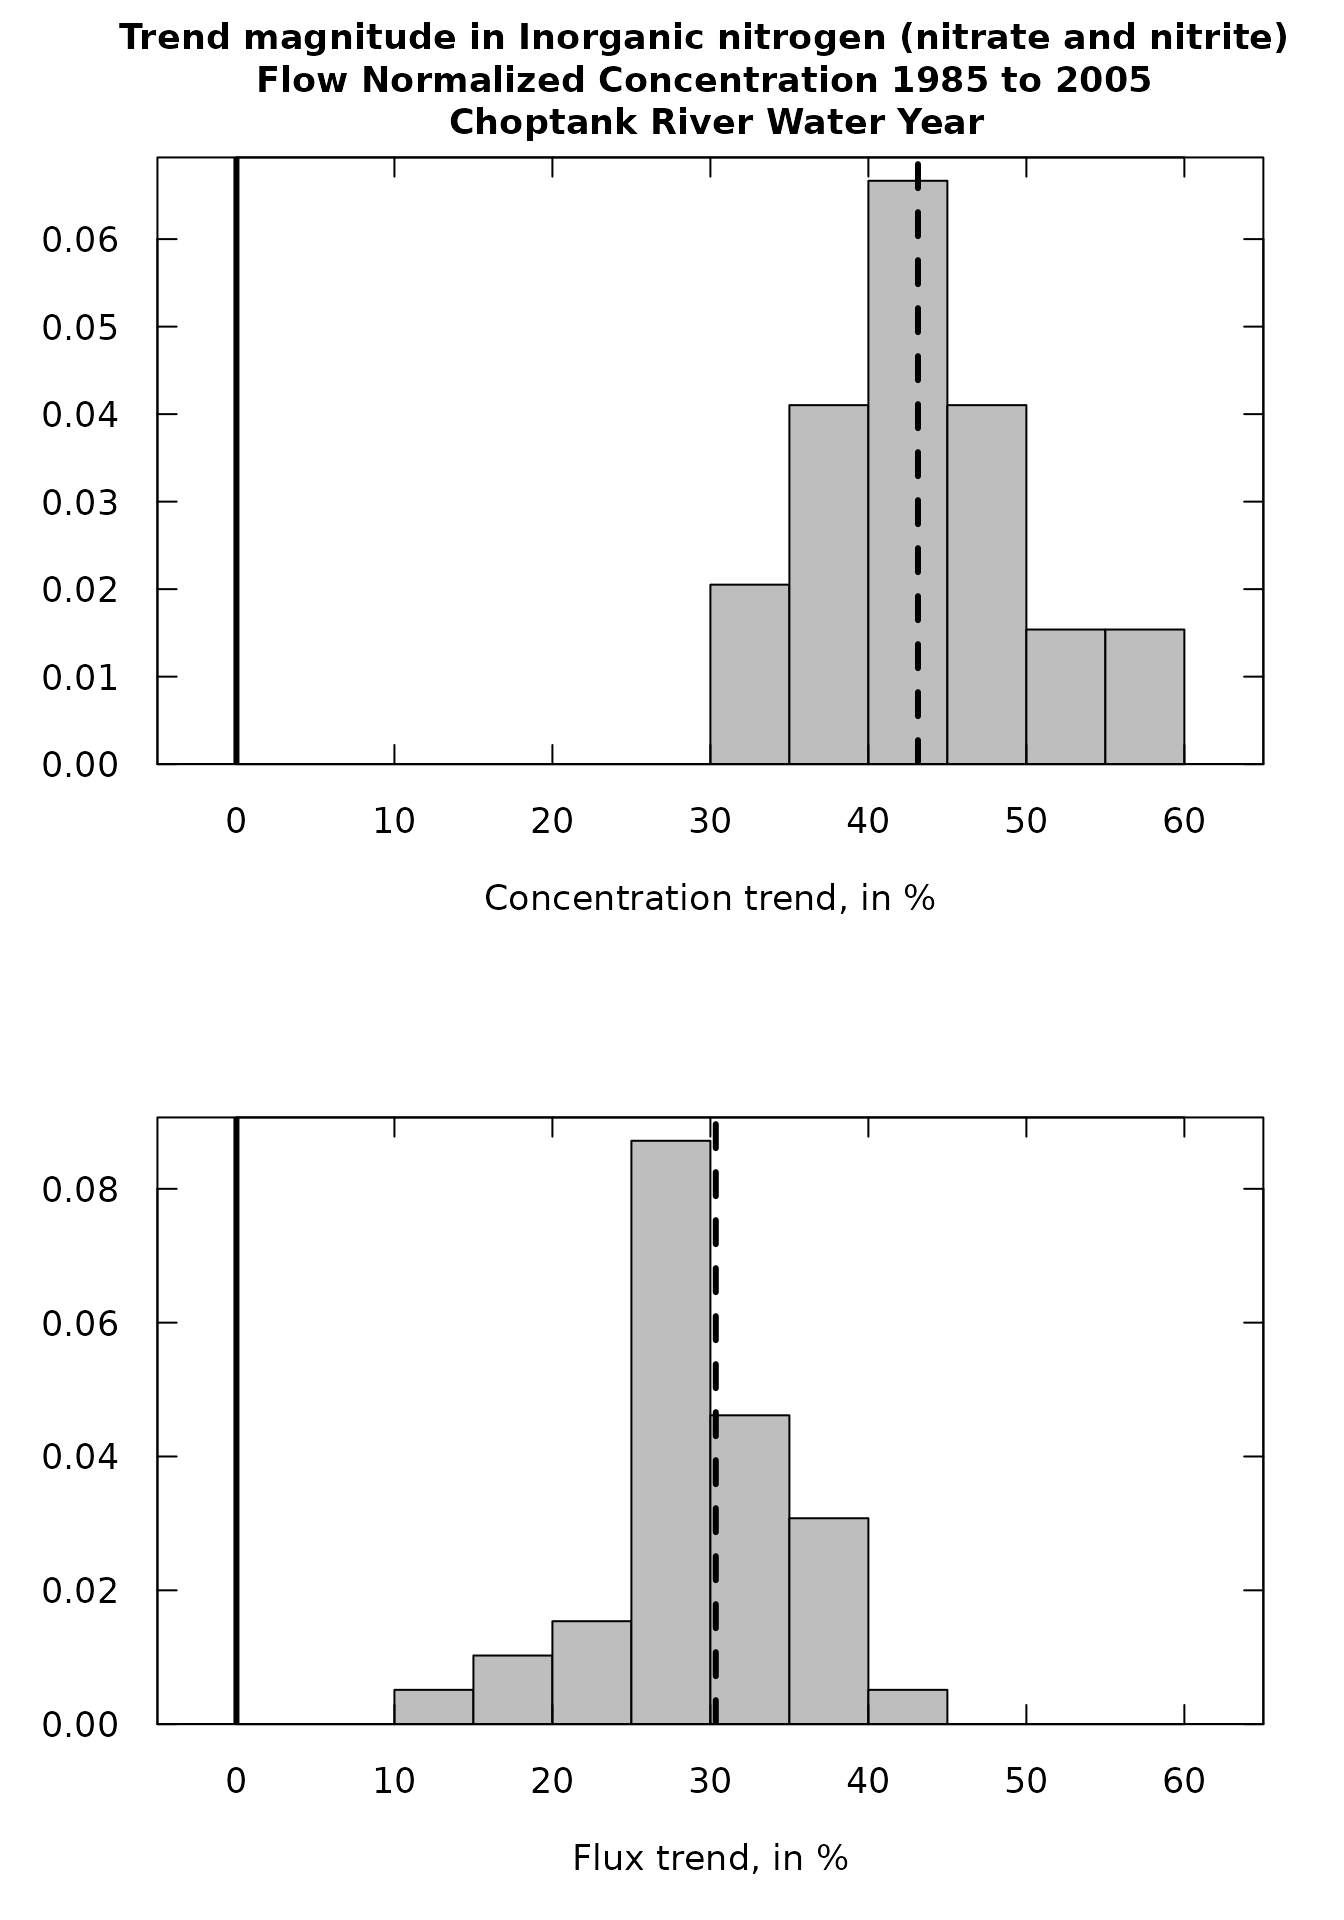
Confidence Bands
Introduction
The purpose here is to produce a graphic that looks just like those
produced by plotConcHist or plotFluxHist but
with the addition of confidence bands around the flow-normalized
histories. There are two versions of the workflow for confidence bands,
the first just uses a single computer core which means it takes a long
time to run (jobs can take an hour or more), but it is simple to run. It
uses the function ciCalculations and can be run
interactively or in batch. Two scripts for that are provided below. It
is best done in the Terminal or some other window, rather than in the
console. If run in the console it will make it impossible for other work
in R to take place while the job is running. The second way it can be
done is using parallel computing in R. A script for that purpose is
provided. It does require three extra packages be installed
(foreach, doParallel, and
iterators). It is also best to run this in the
Terminal, because if it is run in the console, no other R work can be
done while it is running.
Preliminary Steps
Regardless of the approach (single core or parallel) being taken to the computations, the user needs to set up any non-default values of the parameters for model estimation and period of analysis. For example:
If the period of analysis is to be anything other than a Water Year
(paStart=10, paLong=12), the user must use the setPA
function. For example if we want to do the analysis for the three months
starting with April, the command would be
eList <- setPA(eList, paStart = 4, paLong = 3).
If the desired value of windowY was 10 rather than the default value
of 7, then the command needed would be
eList$INFO$windowY <- 10, similar commands can be used
for windowQ, windowS, minNumObs, minNumUncen and edgeAdjust (see help
page for modelEstimation).
It is imperative that the standard WRTDS trend analysis be run prior
to running the code for the confidence bands. If the user has made
changes in smoothing parameters or modified the data in any way since
the last time modelEstimation was run, the standard running
of modelEstimation must be done and the output saved as
eList. The commands would be:
eList <- modelEstimation(eList)Simple Workflow
This example workflow assumes that we use the default values (nBoot = 100) for all of the model parameters and PA and uses the example eList provided in the package. Remember, this is a very long-running process:
library(EGRET)
library(EGRETci)

eList <- Choptank_eList

CIAnnualResults <- ciCalculations(eList)

save(eList,CIAnnualResults, file="CIAnnualResults.RData")
To run the ciCalculations function in batch mode, the
only difference is that additional arguments are specified in the call
to the function. For example the call to ciCalculations
might read as follows:
CIAnnualResults <- ciCalculations(eList, nBoot = 100, blockLength = 200, widthCI = 90)As long as all required arguments (nBoot, blockLength, and widthCI) are specified there will be no interaction needed.
Parallel Computing
Taking advantage of the foreach package to do parallel computing:
library(foreach)
library(doParallel)
library(iterators)
library(EGRET)
library(EGRETci)
eList <- Choptank_eList
eList <- modelEstimation(eList)
nBoot <- 100
blockLength <- 200
coreOut <- 1 #Number of cores to leave out of processing tasks
widthCI <- 90
ciLower <- (50-(widthCI/2))/100
ciUpper <- (50+(widthCI/2))/100
probs <- c(ciLower,ciUpper)
nCores <- detectCores() - coreOut
cl <- makeCluster(nCores)
registerDoParallel(cl)
repAnnual <- foreach(n = 1:nBoot,.packages=c('EGRETci')) %dopar% {
annualResults <- bootAnnual(eList,
blockLength,
startSeed = n)
}
stopCluster(cl)
# save(repAnnual, file="repAnnual.RData")
CIAnnualResults <- ciBands(eList, repAnnual, probs)
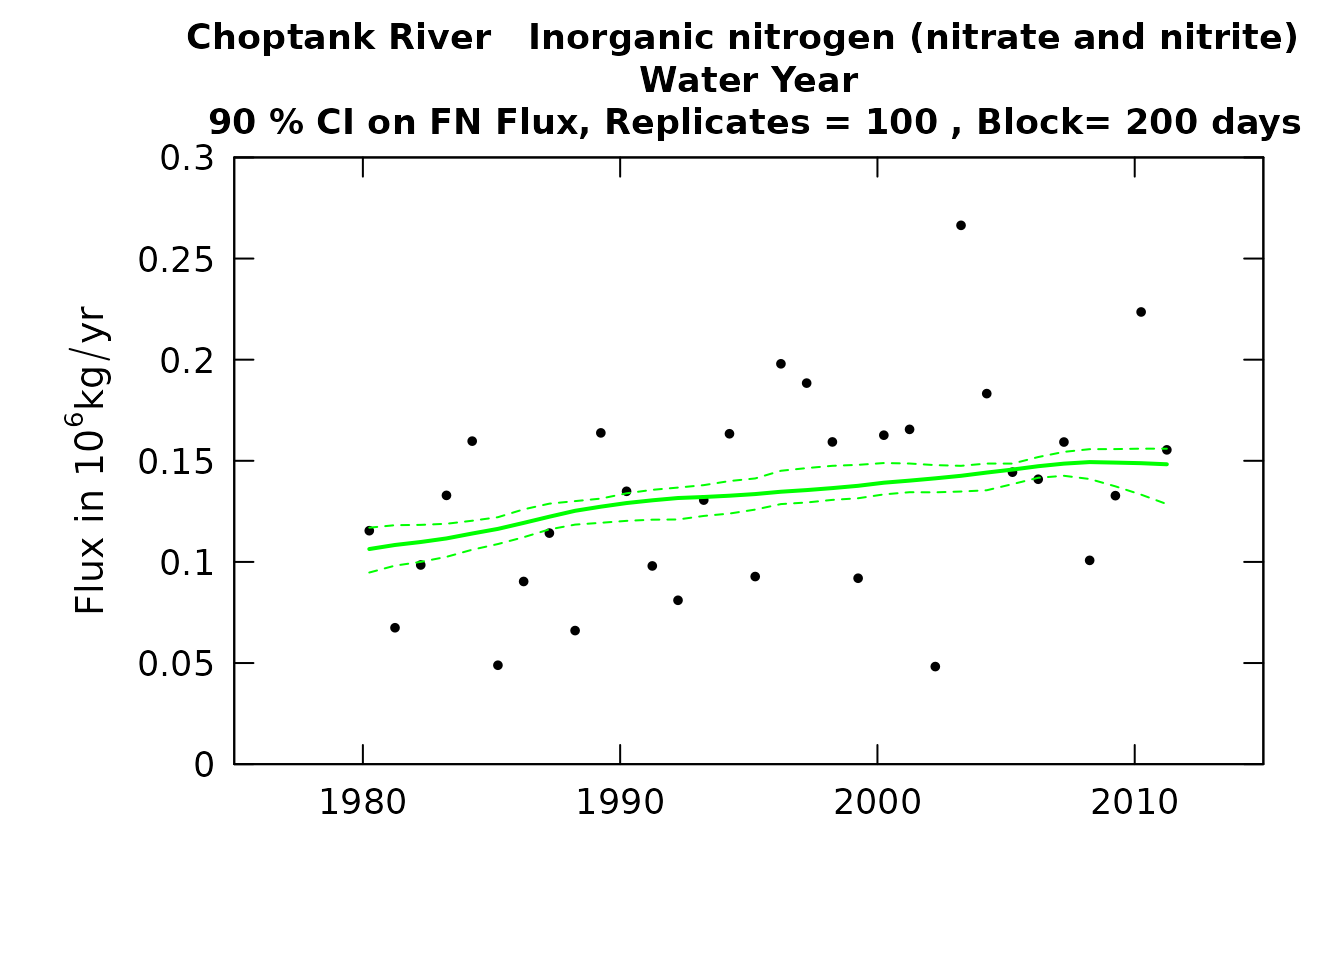
save(eList,CIAnnualResults, file="CIAnnualResults.RData")CI Result Plots
Regardless of the way that the computations are done the outputs that
are needed for the graphics are contained in eList and CIAnnualResults
(which in either script will end up in a file called
CIAnnualResults.RData). Once that file is loaded the graphics can be
produced using the functions plotConcHistBoot and
plotFluxHistBoot. Each of these functions only require two
arguments (eList and CIAnnualResults). However, the user can specify a
number of other arguments. These other arguments are the same ones used
in the plotConcHist and plotFluxHist functions
in the base EGRET package.
The user can also view a table of the confidence interval values
shown in these graphics simply by using the command
CIAnnualResults (fluxes will be in units if kg/day).
Here is a script for producing these graphics, using the example eList and CIAnnualResults data frames included in the package.
eList <- Choptank_eList

CIAnnualResults <- Choptank_CIAnnualResults

plotConcHistBoot(eList, CIAnnualResults)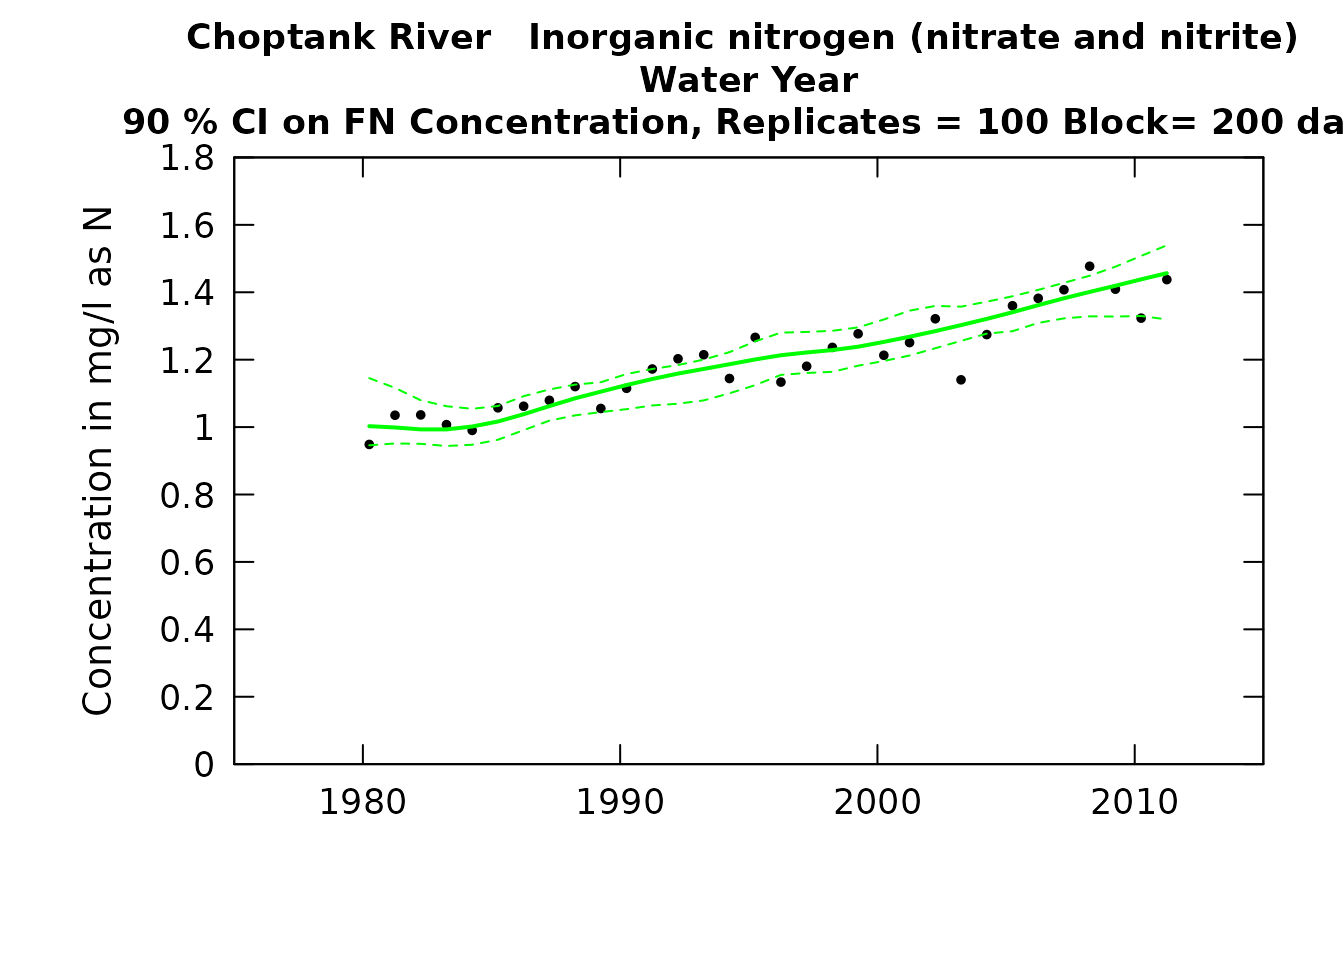
plotFluxHistBoot(eList, CIAnnualResults)