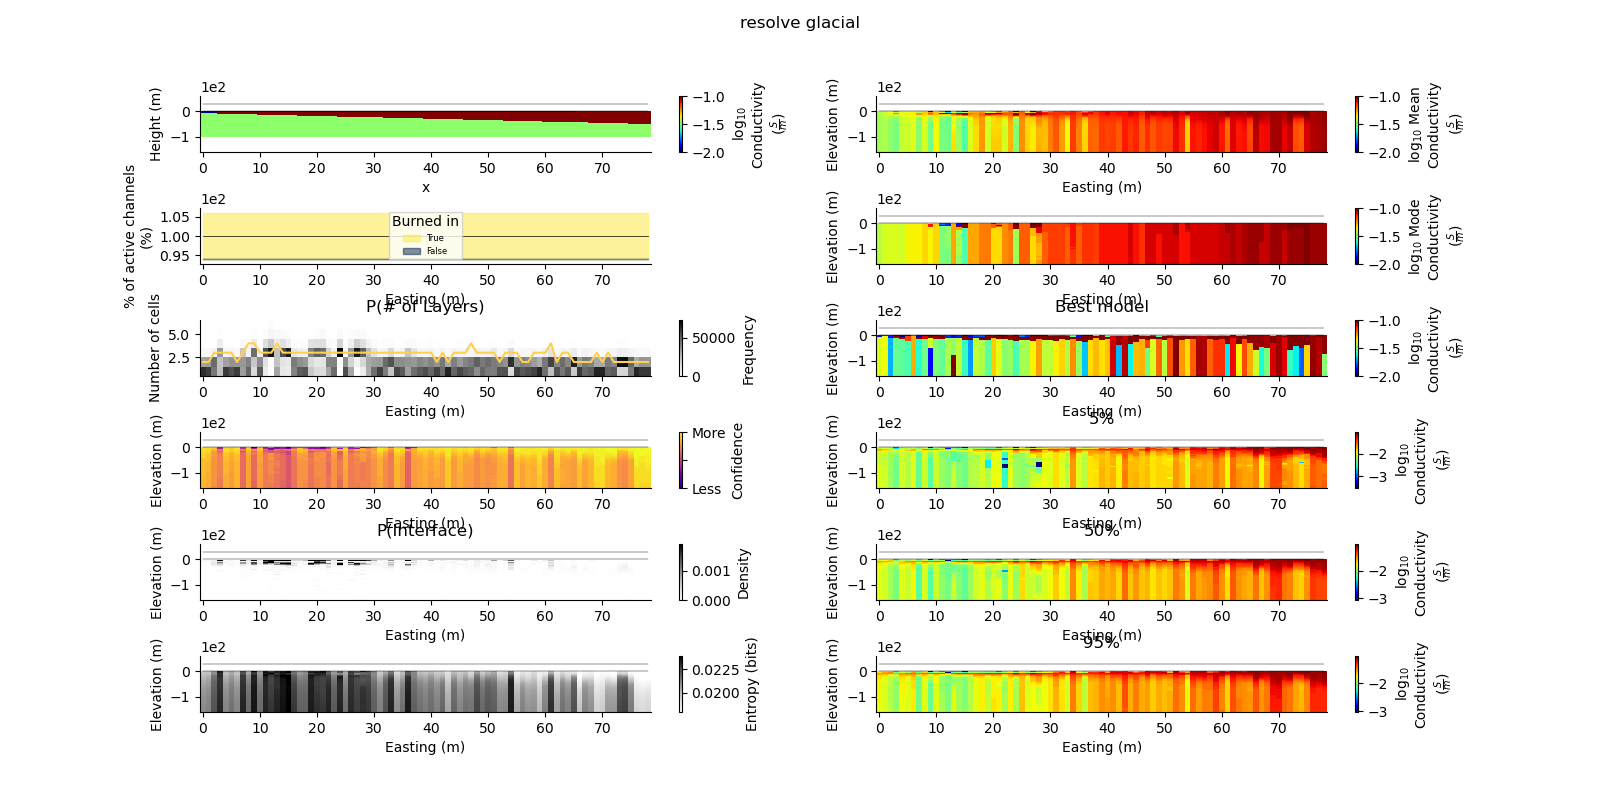
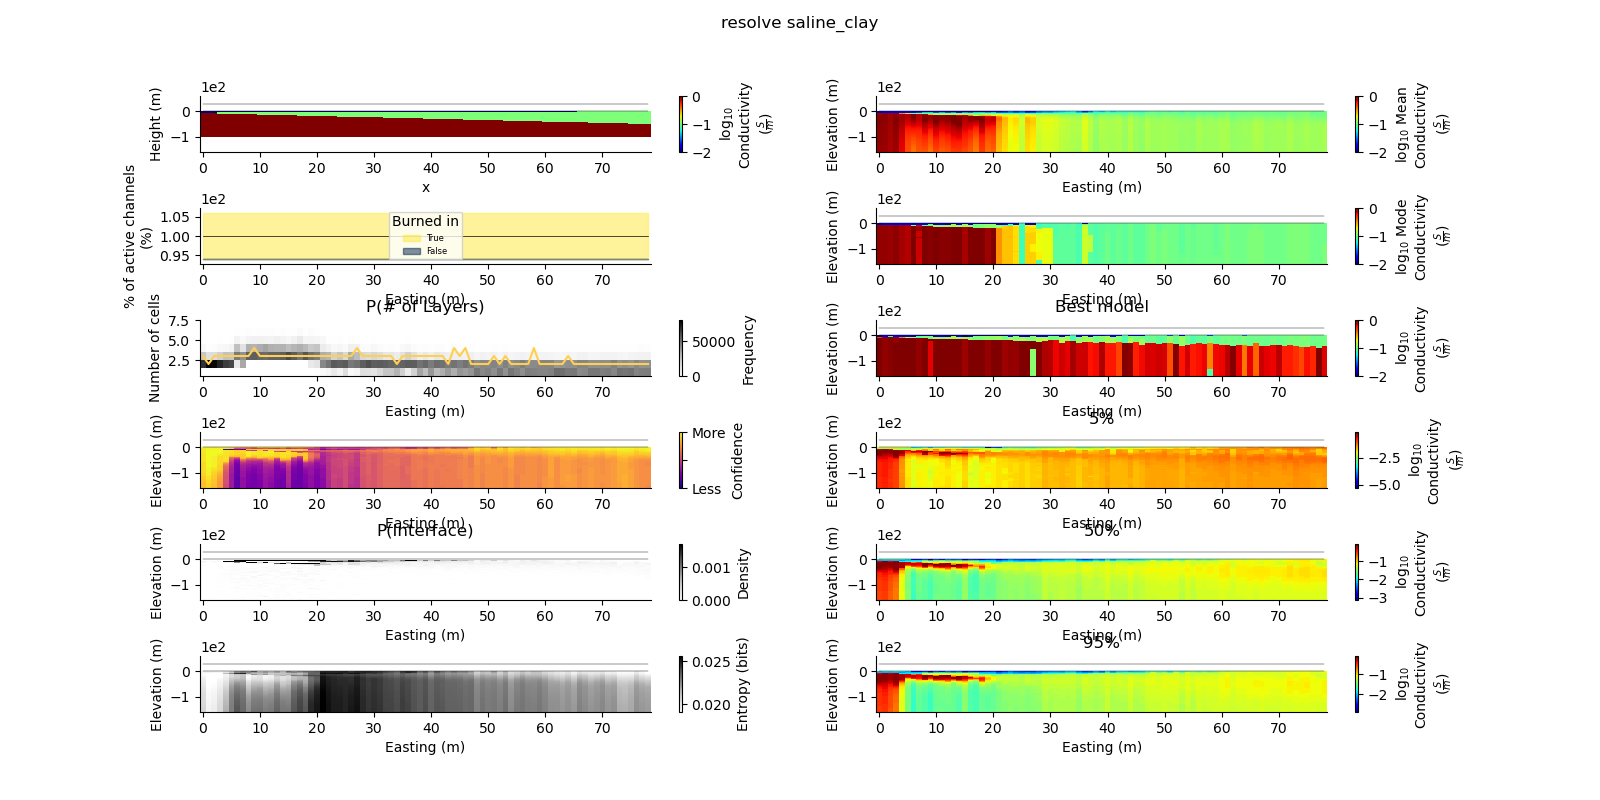
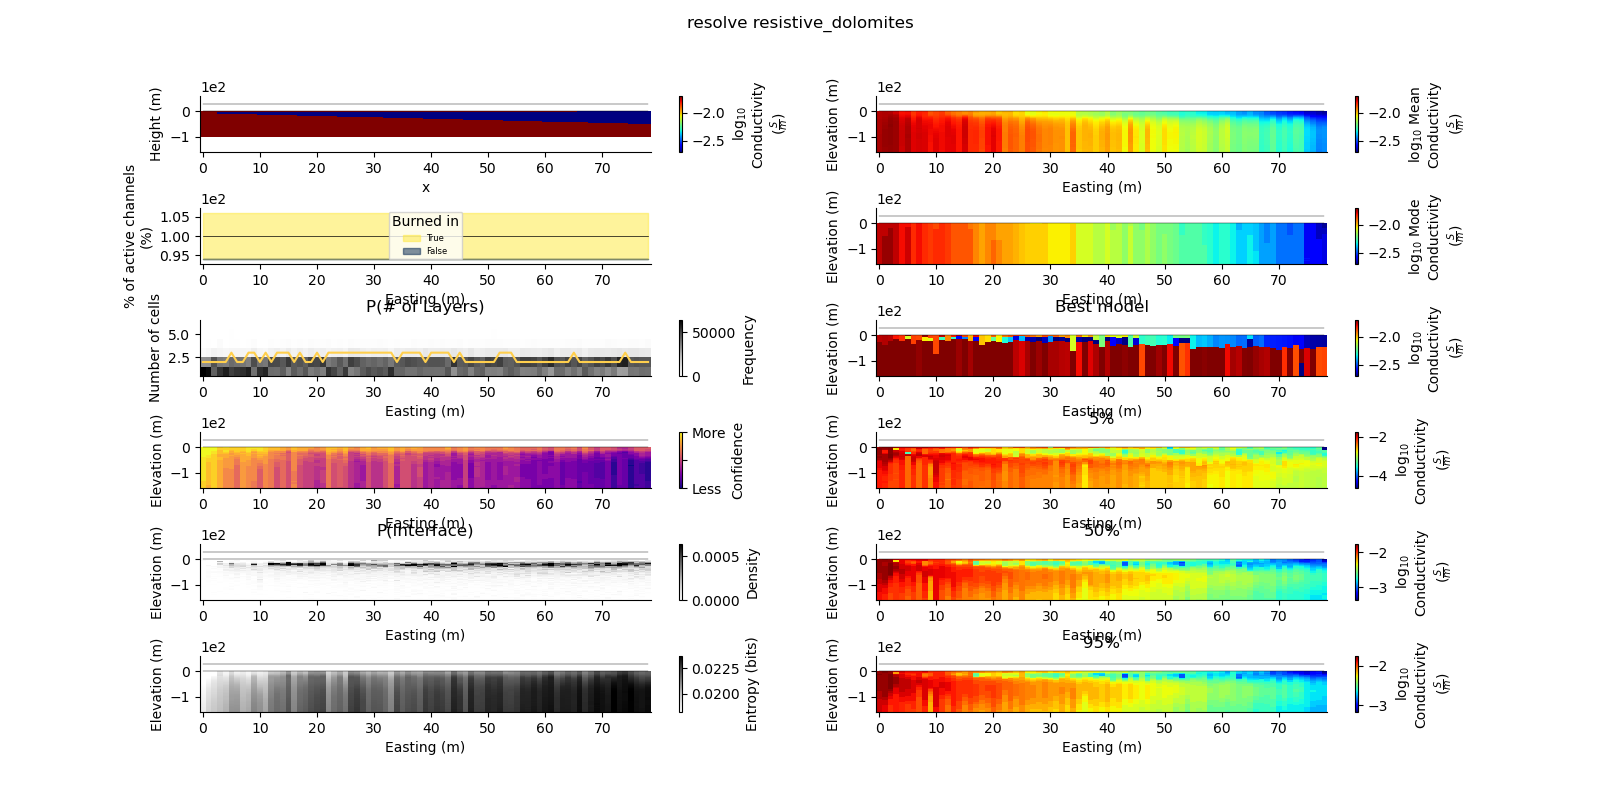
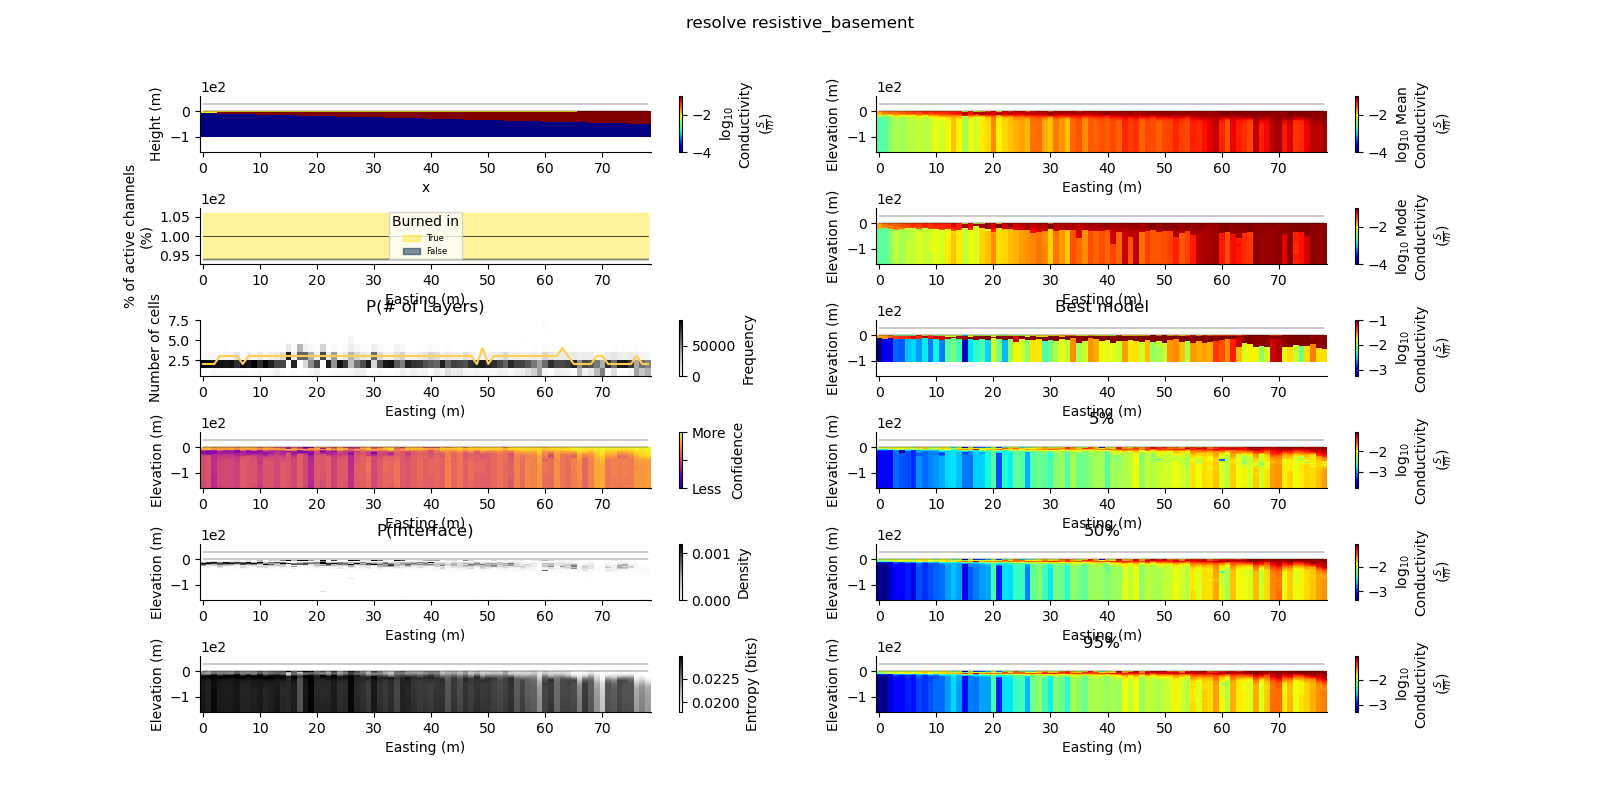
Note
Go to the end to download the full example code.
2D Posterior analysis of Resolve inference
All plotting in GeoBIPy can be carried out using the 3D inference class
import matplotlib.pyplot as plt
import numpy as np
from geobipy import Model
from geobipy import Inference2D

def plot_2d_summary(folder, data_type, model_type):
   #%%
   # Inference for a line of inferences
   # ++++++++++++++++++++++++++++++++++
   #
   # We can instantiate the inference handler by providing a path to the directory containing
   # HDF5 files generated by GeoBIPy.
   #
   # The InfereceXD classes are low memory.  They only read information from the HDF5 files
   # as and when it is needed.
   #
   # The first time you use these classes to create plots, expect longer initial processing times.
   # I precompute expensive properties and store them in the HDF5 files for later use.

   from numpy.random import Generator
   from numpy.random import PCG64DXSM
   generator = PCG64DXSM(seed=0)
   prng = Generator(generator)

   #%%
   results_2d = Inference2D.fromHdf('{}/{}/{}/0.0.h5'.format(folder, data_type, model_type), prng=prng)

   kwargs = {
         "log" : 10,
         "cmap" : 'jet'
         }

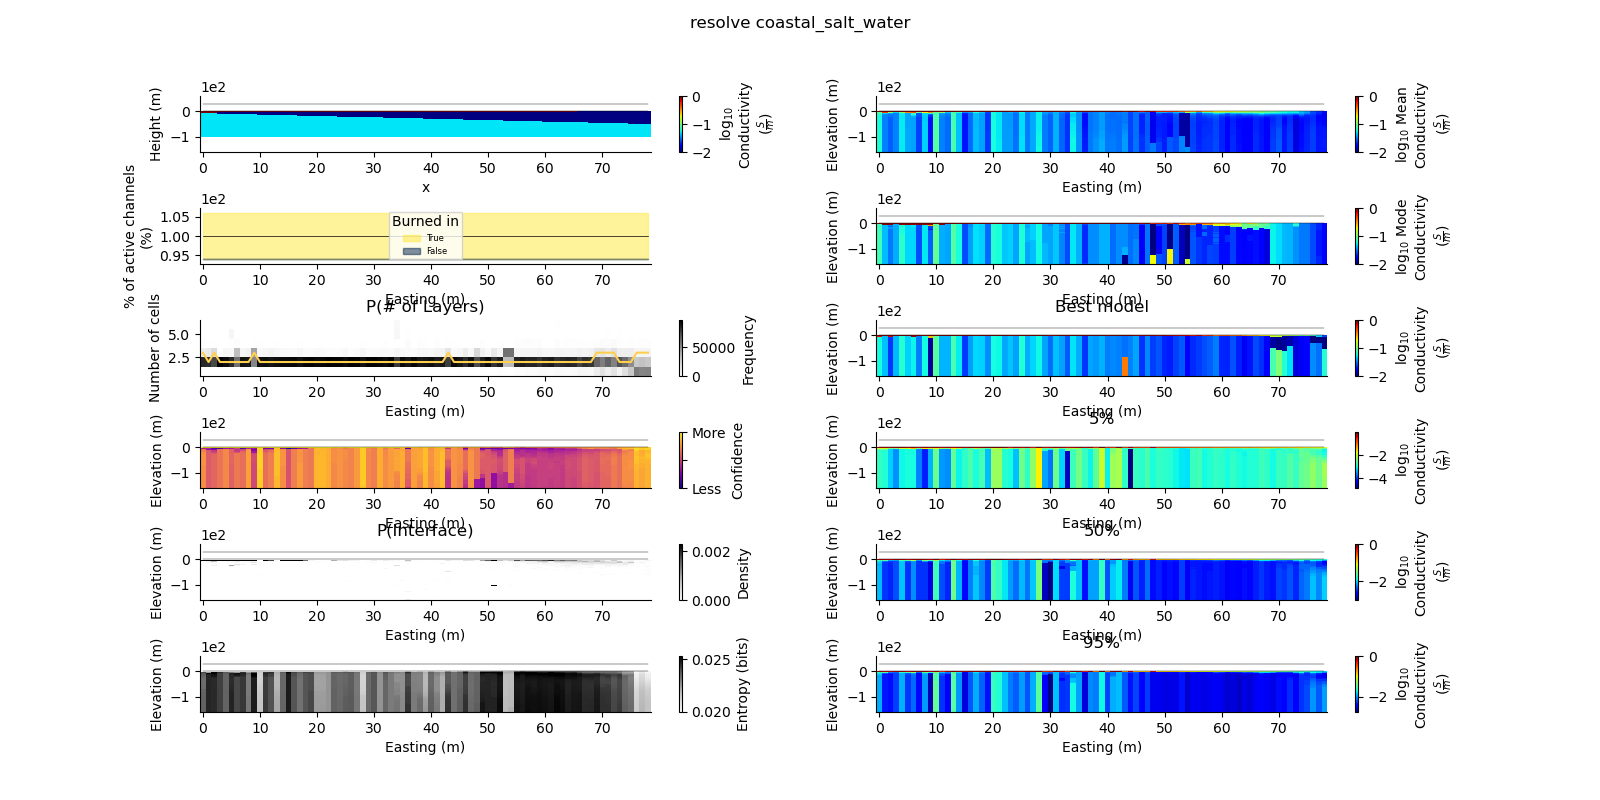
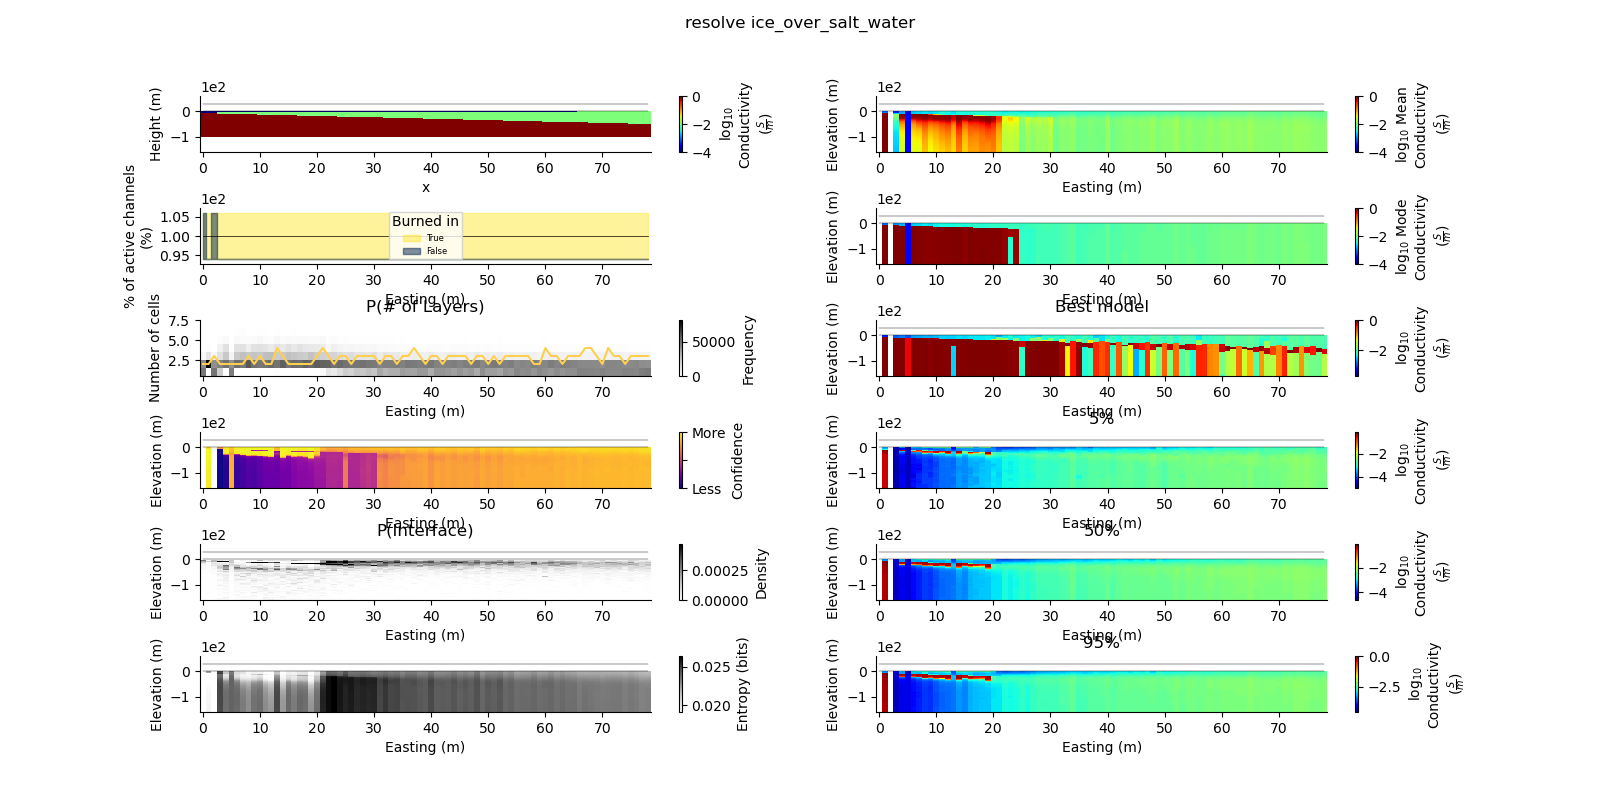
   fig = plt.figure(figsize=(16, 8))
   plt.suptitle("{} {}".format(data_type, model_type))
   gs0 = fig.add_gridspec(6, 2, hspace=1.0)

   true_model = Model.create_synthetic_model(model_type)
   true_model.mesh.y_edges = true_model.mesh.y_edges / 10.0

   kwargs['vmin'] = np.log10(np.min(true_model.values))
   kwargs['vmax'] = np.log10(np.max(true_model.values))

   ax = fig.add_subplot(gs0[0, 0])
   true_model.pcolor(flipY=True, ax=ax, wrap_clabel=True, **kwargs)
   results_2d.plot_data_elevation(linewidth=0.3, ax=ax, xlabel=False, ylabel=False);
   results_2d.plot_elevation(linewidth=0.3, ax=ax, xlabel=False, ylabel=False);

   plt.ylim([-160, 60])

   ax1 = fig.add_subplot(gs0[0, 1], sharex=ax, sharey=ax)
   results_2d.plot_mean_model(ax=ax1, wrap_clabel=True, **kwargs);
   results_2d.plot_data_elevation(linewidth=0.3, ax=ax1);
   results_2d.plot_elevation(linewidth=0.3, ax=ax1);

   # By adding the useVariance keyword, we can make regions of lower confidence more transparent
   ax1 = fig.add_subplot(gs0[1, 1], sharex=ax, sharey=ax)
   results_2d.plot_mode_model(ax=ax1, wrap_clabel=True, **kwargs);
   results_2d.plot_data_elevation(linewidth=0.3, ax=ax1);
   results_2d.plot_elevation(linewidth=0.3, ax=ax1);

   # # # # # We can also choose to keep parameters above the DOI opaque.
   # # # # results_2d.compute_doi()
   # # # # plt.subplot(313)
   # # # # results_2d.plot_mean_model(use_variance=True, mask_below_doi=True, **kwargs);
   # # # # results_2d.plot_data_elevation(linewidth=0.3);
   # # # # results_2d.plot_elevation(linewidth=0.3);

   ax1 = fig.add_subplot(gs0[2, 1], sharex=ax, sharey=ax)
   results_2d.plot_best_model(ax=ax1, wrap_clabel=True, **kwargs);
   results_2d.plot_data_elevation(linewidth=0.3, ax=ax1);
   results_2d.plot_elevation(linewidth=0.3, ax=ax1);
   ax1.set_title('Best model')

   del kwargs['vmin']
   del kwargs['vmax']

   ax1 = fig.add_subplot(gs0[3, 1], sharex=ax, sharey=ax); ax1.set_title('5%')
   results_2d.plot_percentile(ax=ax1, percent=0.05, wrap_clabel=True, **kwargs)
   results_2d.plot_data_elevation(linewidth=0.3, ax=ax1);
   results_2d.plot_elevation(linewidth=0.3, ax=ax1);

   ax1 = fig.add_subplot(gs0[4, 1], sharex=ax, sharey=ax); ax1.set_title('50%')
   results_2d.plot_percentile(ax=ax1, percent=0.5, wrap_clabel=True, **kwargs)
   results_2d.plot_data_elevation(linewidth=0.3, ax=ax1);
   results_2d.plot_elevation(linewidth=0.3, ax=ax1);

   ax1 = fig.add_subplot(gs0[5, 1], sharex=ax, sharey=ax); ax1.set_title('95%')
   results_2d.plot_percentile(ax=ax1, percent=0.95, wrap_clabel=True, **kwargs)
   results_2d.plot_data_elevation(linewidth=0.3, ax=ax1);
   results_2d.plot_elevation(linewidth=0.3, ax=ax1);

   #%%
   # We can plot the parameter values that produced the highest posterior
   ax1 = fig.add_subplot(gs0[2, 0], sharex=ax)
   results_2d.plot_k_layers(ax=ax1, wrap_ylabel=True)

   ax1 = fig.add_subplot(gs0[1, 0], sharex=ax)

   ll, bb, ww, hh = ax1.get_position().bounds
   ax1.set_position([ll, bb, ww*0.8, hh])

   results_2d.plot_channel_saturation(ax=ax1, wrap_ylabel=True)
   results_2d.plot_burned_in(ax=ax1, underlay=True)

   #%%
   # Now we can start plotting some more interesting posterior properties.
   # How about the confidence?
   ax1 = fig.add_subplot(gs0[3, 0], sharex=ax, sharey=ax)
   results_2d.plot_confidence(ax=ax1);
   results_2d.plot_data_elevation(ax=ax1, linewidth=0.3);
   results_2d.plot_elevation(ax=ax1, linewidth=0.3);

   #%%
   # We can take the interface depth posterior for each data point,
   # and display an interface probability cross section
   # This posterior can be washed out, so the clim_scaling keyword lets me saturate
   # the top and bottom 0.5% of the colour range
   ax1 = fig.add_subplot(gs0[4, 0], sharex=ax, sharey=ax)
   ax1.set_title('P(Interface)')
   results_2d.plot_interfaces(cmap='Greys', clim_scaling=0.5, ax=ax1);
   results_2d.plot_data_elevation(linewidth=0.3, ax=ax1);
   results_2d.plot_elevation(linewidth=0.3, ax=ax1);

   ax1 = fig.add_subplot(gs0[5, 0], sharex=ax, sharey=ax)
   results_2d.plot_entropy(cmap='Greys', clim_scaling=0.5, ax=ax1);
   results_2d.plot_data_elevation(linewidth=0.3, ax=ax1);
   results_2d.plot_elevation(linewidth=0.3, ax=ax1);


   plt.show()
   # plt.savefig('{}_{}.png'.format(data_type, model_type), dpi=300)

if __name__ == '__main__':
   models = ['glacial', 'saline_clay', 'resistive_dolomites', 'resistive_basement', 'coastal_salt_water', 'ice_over_salt_water']

   for model in models:
      try:
         plot_2d_summary("../../../Parallel_Inference/", "resolve", model)
      except Exception as e:
         print(model)
         print(e)
         pass
Total running time of the script: (0 minutes 22.172 seconds)
