Note
Go to the end to download the full example code.
2D Posterior analysis of Skytem inference
All plotting in GeoBIPy can be carried out using the 3D inference class
self.n_components=1, self.nTimes=array([26, 19])
self.n_components=1, self.nTimes=array([26, 19])
self.n_components=1, self.nTimes=array([26, 19])
self.n_components=1, self.nTimes=array([26, 19])
self.n_components=1, self.nTimes=array([26, 19])
self.n_components=1, self.nTimes=array([26, 19])
self.n_components=1, self.nTimes=array([26, 19])
self.n_components=1, self.nTimes=array([26, 19])
self.n_components=1, self.nTimes=array([26, 19])
self.n_components=1, self.nTimes=array([26, 19])
self.n_components=1, self.nTimes=array([26, 19])
self.n_components=1, self.nTimes=array([26, 19])
self.n_components=1, self.nTimes=array([26, 19])
self.n_components=1, self.nTimes=array([26, 19])
self.n_components=1, self.nTimes=array([26, 19])
self.n_components=1, self.nTimes=array([26, 19])
self.n_components=1, self.nTimes=array([26, 19])
self.n_components=1, self.nTimes=array([26, 19])
self.n_components=1, self.nTimes=array([26, 19])
self.n_components=1, self.nTimes=array([26, 19])
Model:
mesh:
|   RectilinearMesh2D:
|   Shape: : (79, 133)
|   x
|   RectilinearMesh1D
|   Number of Cells:
|   |   79
|   Cell Centres:
|   |   StatArray
|   |   Name:   Easting (m)
|   |   Address:['0x1544463d0']
|   |   Shape:  (79,)
|   |   Values: [ 0.  1.  2. ... 76. 77. 78.]
|   |   Min:    0.0
|   |   Max:    78.0
|   |   has_posterior: False
|
|   Cell Edges:
|   |   StatArray
|   |   Name:   Easting (m)
|   |   Address:['0x154445d50']
|   |   Shape:  (80,)
|   |   Values: [-0.5  0.5  1.5 ... 76.5 77.5 78.5]
|   |   Min:    -0.5
|   |   Max:    78.5
|   |   has_posterior: False
|
|   log:
|   |   None
|   relative_to:
|   |   StatArray
|   |   Name:
|   |   Address:['0x150930a50']
|   |   Shape:  (1,)
|   |   Values: [0.]
|   |   Min:    0.0
|   |   Max:    0.0
|   |   has_posterior: False
|
|   y
|   RectilinearMesh1D
|   Number of Cells:
|   |   133
|   Cell Centres:
|   |   StatArray
|   |   Name:   elevation (m)
|   |   Address:['0x1544457d0']
|   |   Shape:  (133,)
|   |   Values: [  -2.08834586   -6.26503759  -10.44172932 ... -545.05827068 -549.23496241
|   |    -553.41165414]
|   |   Min:    -553.4116541353383
|   |   Max:    -2.088345864661654
|   |   has_posterior: False
|
|   Cell Edges:
|   |   StatArray
|   |   Name:   elevation (m)
|   |   Address:['0x1544451d0']
|   |   Shape:  (134,)
|   |   Values: [   0.           -4.17669173   -8.35338346 ... -547.14661654 -551.32330827
|   |    -555.5       ]
|   |   Min:    -555.5
|   |   Max:    0.0
|   |   has_posterior: False
|
|   log:
|   |   None
|   relative_to:
|   |   StatArray
|   |   Name:   Elevation (m)
|   |   Address:['0x1509319d0']
|   |   Shape:  (79,)
|   |   Values: [0. 0. 0. ... 0. 0. 0.]
|   |   Min:    0.0
|   |   Max:    0.0
|   |   has_posterior: False
|
values:
|   StatArray
|   Name:   Mean Conductivity ($\frac{S}{m}$)
|   Address:['0x154445ed0']
|   Shape:  (79, 133)
|   Values: [[0.0098107  0.0098107  0.00977812 ... 0.01979067 0.01975604 0.01975604]
|    [0.00961295 0.00961295 0.00952388 ... 0.01824047 0.01795631 0.01787678]
|    [0.01039665 0.01039665 0.01020258 ... 0.01897964 0.01913258 0.01914486]
|    ...
|    [0.07238788 0.07238788 0.08586626 ... 0.0927832  0.09265059 0.09264398]
|    [0.07901261 0.07901261 0.08784271 ... 0.08837423 0.08822111 0.08819736]
|    [0.08834698 0.08834698 0.09181098 ... 0.09051302 0.09045352 0.09052142]]
|   Min:    0.004079735854704791
|   Max:    0.13671941182403904
|   has_posterior: False


self.n_components=1, self.nTimes=array([26, 19])
self.n_components=1, self.nTimes=array([26, 19])
self.n_components=1, self.nTimes=array([26, 19])
self.n_components=1, self.nTimes=array([26, 19])
self.n_components=1, self.nTimes=array([26, 19])
self.n_components=1, self.nTimes=array([26, 19])
self.n_components=1, self.nTimes=array([26, 19])
self.n_components=1, self.nTimes=array([26, 19])
self.n_components=1, self.nTimes=array([26, 19])
self.n_components=1, self.nTimes=array([26, 19])
self.n_components=1, self.nTimes=array([26, 19])
self.n_components=1, self.nTimes=array([26, 19])
self.n_components=1, self.nTimes=array([26, 19])
self.n_components=1, self.nTimes=array([26, 19])
self.n_components=1, self.nTimes=array([26, 19])
self.n_components=1, self.nTimes=array([26, 19])
self.n_components=1, self.nTimes=array([26, 19])
self.n_components=1, self.nTimes=array([26, 19])
self.n_components=1, self.nTimes=array([26, 19])
self.n_components=1, self.nTimes=array([26, 19])
self.n_components=1, self.nTimes=array([26, 19])
self.n_components=1, self.nTimes=array([26, 19])
self.n_components=1, self.nTimes=array([26, 19])
self.n_components=1, self.nTimes=array([26, 19])
self.n_components=1, self.nTimes=array([26, 19])
Model:
mesh:
|   RectilinearMesh2D:
|   Shape: : (79, 133)
|   x
|   RectilinearMesh1D
|   Number of Cells:
|   |   79
|   Cell Centres:
|   |   StatArray
|   |   Name:   Easting (m)
|   |   Address:['0x1544c18d0']
|   |   Shape:  (79,)
|   |   Values: [ 0.  1.  2. ... 76. 77. 78.]
|   |   Min:    0.0
|   |   Max:    78.0
|   |   has_posterior: False
|
|   Cell Edges:
|   |   StatArray
|   |   Name:   Easting (m)
|   |   Address:['0x1544c2550']
|   |   Shape:  (80,)
|   |   Values: [-0.5  0.5  1.5 ... 76.5 77.5 78.5]
|   |   Min:    -0.5
|   |   Max:    78.5
|   |   has_posterior: False
|
|   log:
|   |   None
|   relative_to:
|   |   StatArray
|   |   Name:
|   |   Address:['0x14dcef3d0']
|   |   Shape:  (1,)
|   |   Values: [0.]
|   |   Min:    0.0
|   |   Max:    0.0
|   |   has_posterior: False
|
|   y
|   RectilinearMesh1D
|   Number of Cells:
|   |   133
|   Cell Centres:
|   |   StatArray
|   |   Name:   elevation (m)
|   |   Address:['0x1544c20d0']
|   |   Shape:  (133,)
|   |   Values: [  -2.08834586   -6.26503759  -10.44172932 ... -545.05827068 -549.23496241
|   |    -553.41165414]
|   |   Min:    -553.4116541353383
|   |   Max:    -2.088345864661654
|   |   has_posterior: False
|
|   Cell Edges:
|   |   StatArray
|   |   Name:   elevation (m)
|   |   Address:['0x1544c14d0']
|   |   Shape:  (134,)
|   |   Values: [   0.           -4.17669173   -8.35338346 ... -547.14661654 -551.32330827
|   |    -555.5       ]
|   |   Min:    -555.5
|   |   Max:    0.0
|   |   has_posterior: False
|
|   log:
|   |   None
|   relative_to:
|   |   StatArray
|   |   Name:   Elevation (m)
|   |   Address:['0x1544c32d0']
|   |   Shape:  (79,)
|   |   Values: [0. 0. 0. ... 0. 0. 0.]
|   |   Min:    0.0
|   |   Max:    0.0
|   |   has_posterior: False
|
values:
|   StatArray
|   Name:   Mean Conductivity ($\frac{S}{m}$)
|   Address:['0x1544c3950']
|   Shape:  (79, 133)
|   Values: [[0.01047203 0.01047203 0.01005625 ... 0.05296168 0.05254504 0.05254504]
|    [0.00987222 0.00987222 0.00962163 ... 0.05487486 0.05487486 0.05483357]
|    [0.01060059 0.01060059 0.01051259 ... 0.03503385 0.03484541 0.03459899]
|    ...
|    [0.07284539 0.07284539 0.08961911 ... 0.08926087 0.08945951 0.08945951]
|    [0.07937758 0.07937758 0.0862112  ... 0.08566146 0.08588471 0.08589202]
|    [0.08799997 0.08799997 0.09166232 ... 0.08897954 0.08890017 0.08888421]]
|   Min:    0.005778639158922619
|   Max:    1.6155899738665087
|   has_posterior: False


self.n_components=1, self.nTimes=array([26, 19])
self.n_components=1, self.nTimes=array([26, 19])
self.n_components=1, self.nTimes=array([26, 19])
self.n_components=1, self.nTimes=array([26, 19])
self.n_components=1, self.nTimes=array([26, 19])
self.n_components=1, self.nTimes=array([26, 19])
self.n_components=1, self.nTimes=array([26, 19])
self.n_components=1, self.nTimes=array([26, 19])
self.n_components=1, self.nTimes=array([26, 19])
self.n_components=1, self.nTimes=array([26, 19])
self.n_components=1, self.nTimes=array([26, 19])
self.n_components=1, self.nTimes=array([26, 19])
self.n_components=1, self.nTimes=array([26, 19])
self.n_components=1, self.nTimes=array([26, 19])
self.n_components=1, self.nTimes=array([26, 19])
self.n_components=1, self.nTimes=array([26, 19])
self.n_components=1, self.nTimes=array([26, 19])
self.n_components=1, self.nTimes=array([26, 19])
self.n_components=1, self.nTimes=array([26, 19])
self.n_components=1, self.nTimes=array([26, 19])
self.n_components=1, self.nTimes=array([26, 19])
self.n_components=1, self.nTimes=array([26, 19])
self.n_components=1, self.nTimes=array([26, 19])
self.n_components=1, self.nTimes=array([26, 19])
self.n_components=1, self.nTimes=array([26, 19])
Model:
mesh:
|   RectilinearMesh2D:
|   Shape: : (79, 133)
|   x
|   RectilinearMesh1D
|   Number of Cells:
|   |   79
|   Cell Centres:
|   |   StatArray
|   |   Name:   Easting (m)
|   |   Address:['0x1507bcb50']
|   |   Shape:  (79,)
|   |   Values: [ 0.  1.  2. ... 76. 77. 78.]
|   |   Min:    0.0
|   |   Max:    78.0
|   |   has_posterior: False
|
|   Cell Edges:
|   |   StatArray
|   |   Name:   Easting (m)
|   |   Address:['0x1507be050']
|   |   Shape:  (80,)
|   |   Values: [-0.5  0.5  1.5 ... 76.5 77.5 78.5]
|   |   Min:    -0.5
|   |   Max:    78.5
|   |   has_posterior: False
|
|   log:
|   |   None
|   relative_to:
|   |   StatArray
|   |   Name:
|   |   Address:['0x1506b1350']
|   |   Shape:  (1,)
|   |   Values: [0.]
|   |   Min:    0.0
|   |   Max:    0.0
|   |   has_posterior: False
|
|   y
|   RectilinearMesh1D
|   Number of Cells:
|   |   133
|   Cell Centres:
|   |   StatArray
|   |   Name:   elevation (m)
|   |   Address:['0x1507bec50']
|   |   Shape:  (133,)
|   |   Values: [  -2.08834586   -6.26503759  -10.44172932 ... -545.05827068 -549.23496241
|   |    -553.41165414]
|   |   Min:    -553.4116541353383
|   |   Max:    -2.088345864661654
|   |   has_posterior: False
|
|   Cell Edges:
|   |   StatArray
|   |   Name:   elevation (m)
|   |   Address:['0x1507bf750']
|   |   Shape:  (134,)
|   |   Values: [   0.           -4.17669173   -8.35338346 ... -547.14661654 -551.32330827
|   |    -555.5       ]
|   |   Min:    -555.5
|   |   Max:    0.0
|   |   has_posterior: False
|
|   log:
|   |   None
|   relative_to:
|   |   StatArray
|   |   Name:   Elevation (m)
|   |   Address:['0x1507bead0']
|   |   Shape:  (79,)
|   |   Values: [0. 0. 0. ... 0. 0. 0.]
|   |   Min:    0.0
|   |   Max:    0.0
|   |   has_posterior: False
|
values:
|   StatArray
|   Name:   Mean Conductivity ($\frac{S}{m}$)
|   Address:['0x1507be0d0']
|   Shape:  (79, 133)
|   Values: [[0.01825279 0.01825279 0.01931186 ... 0.02170999 0.02174101 0.0217422 ]
|    [0.01614506 0.01614506 0.01636665 ... 0.02128181 0.02121515 0.02126434]
|    [0.01976905 0.01976905 0.01985069 ... 0.01473055 0.01467527 0.01467527]
|    ...
|    [0.00501021 0.00501021 0.00458535 ... 0.01233692 0.01252973 0.01252973]
|    [0.00474996 0.00474996 0.00348994 ... 0.02102289 0.02105033 0.02106124]
|    [0.00280581 0.00280581 0.00272761 ... 0.01825986 0.01839879 0.01841848]]
|   Min:    0.0007035096174085572
|   Max:    16.631343141838055
|   has_posterior: False


self.n_components=1, self.nTimes=array([26, 19])
self.n_components=1, self.nTimes=array([26, 19])
self.n_components=1, self.nTimes=array([26, 19])
self.n_components=1, self.nTimes=array([26, 19])
self.n_components=1, self.nTimes=array([26, 19])
self.n_components=1, self.nTimes=array([26, 19])
self.n_components=1, self.nTimes=array([26, 19])
self.n_components=1, self.nTimes=array([26, 19])
self.n_components=1, self.nTimes=array([26, 19])
self.n_components=1, self.nTimes=array([26, 19])
self.n_components=1, self.nTimes=array([26, 19])
self.n_components=1, self.nTimes=array([26, 19])
self.n_components=1, self.nTimes=array([26, 19])
self.n_components=1, self.nTimes=array([26, 19])
self.n_components=1, self.nTimes=array([26, 19])
self.n_components=1, self.nTimes=array([26, 19])
self.n_components=1, self.nTimes=array([26, 19])
self.n_components=1, self.nTimes=array([26, 19])
self.n_components=1, self.nTimes=array([26, 19])
self.n_components=1, self.nTimes=array([26, 19])
self.n_components=1, self.nTimes=array([26, 19])
self.n_components=1, self.nTimes=array([26, 19])
self.n_components=1, self.nTimes=array([26, 19])
self.n_components=1, self.nTimes=array([26, 19])
self.n_components=1, self.nTimes=array([26, 19])
Model:
mesh:
|   RectilinearMesh2D:
|   Shape: : (79, 133)
|   x
|   RectilinearMesh1D
|   Number of Cells:
|   |   79
|   Cell Centres:
|   |   StatArray
|   |   Name:   Easting (m)
|   |   Address:['0x1503967d0']
|   |   Shape:  (79,)
|   |   Values: [ 0.  1.  2. ... 76. 77. 78.]
|   |   Min:    0.0
|   |   Max:    78.0
|   |   has_posterior: False
|
|   Cell Edges:
|   |   StatArray
|   |   Name:   Easting (m)
|   |   Address:['0x150396350']
|   |   Shape:  (80,)
|   |   Values: [-0.5  0.5  1.5 ... 76.5 77.5 78.5]
|   |   Min:    -0.5
|   |   Max:    78.5
|   |   has_posterior: False
|
|   log:
|   |   None
|   relative_to:
|   |   StatArray
|   |   Name:
|   |   Address:['0x107e39c50']
|   |   Shape:  (1,)
|   |   Values: [0.]
|   |   Min:    0.0
|   |   Max:    0.0
|   |   has_posterior: False
|
|   y
|   RectilinearMesh1D
|   Number of Cells:
|   |   133
|   Cell Centres:
|   |   StatArray
|   |   Name:   elevation (m)
|   |   Address:['0x150396150']
|   |   Shape:  (133,)
|   |   Values: [  -2.08834586   -6.26503759  -10.44172932 ... -545.05827068 -549.23496241
|   |    -553.41165414]
|   |   Min:    -553.4116541353383
|   |   Max:    -2.088345864661654
|   |   has_posterior: False
|
|   Cell Edges:
|   |   StatArray
|   |   Name:   elevation (m)
|   |   Address:['0x150394850']
|   |   Shape:  (134,)
|   |   Values: [   0.           -4.17669173   -8.35338346 ... -547.14661654 -551.32330827
|   |    -555.5       ]
|   |   Min:    -555.5
|   |   Max:    0.0
|   |   has_posterior: False
|
|   log:
|   |   None
|   relative_to:
|   |   StatArray
|   |   Name:   Elevation (m)
|   |   Address:['0x150ffadd0']
|   |   Shape:  (79,)
|   |   Values: [0. 0. 0. ... 0. 0. 0.]
|   |   Min:    0.0
|   |   Max:    0.0
|   |   has_posterior: False
|
values:
|   StatArray
|   Name:   Mean Conductivity ($\frac{S}{m}$)
|   Address:['0x1505ecfd0']
|   Shape:  (79, 133)
|   Values: [[0.00966926 0.00966926 0.00972027 ... 0.04839993 0.04878023 0.04907535]
|    [0.00914014 0.00914014 0.00947082 ... 0.06116167 0.06078523 0.06051578]
|    [0.01018308 0.01018308 0.00990115 ... 0.00281497 0.00282243 0.00282743]
|    ...
|    [0.0720962  0.0720962  0.089987   ... 0.08922937 0.08914909 0.08906875]
|    [0.07927976 0.07927976 0.08631817 ... 0.08918084 0.08928333 0.08936188]
|    [0.08792242 0.08792242 0.09117578 ... 0.09172198 0.09165289 0.09162828]]
|   Min:    0.0015129161039354549
|   Max:    0.2000862444557275
|   has_posterior: False


self.n_components=1, self.nTimes=array([26, 19])
self.n_components=1, self.nTimes=array([26, 19])
self.n_components=1, self.nTimes=array([26, 19])
self.n_components=1, self.nTimes=array([26, 19])
self.n_components=1, self.nTimes=array([26, 19])
self.n_components=1, self.nTimes=array([26, 19])
self.n_components=1, self.nTimes=array([26, 19])
self.n_components=1, self.nTimes=array([26, 19])
self.n_components=1, self.nTimes=array([26, 19])
self.n_components=1, self.nTimes=array([26, 19])
self.n_components=1, self.nTimes=array([26, 19])
self.n_components=1, self.nTimes=array([26, 19])
self.n_components=1, self.nTimes=array([26, 19])
self.n_components=1, self.nTimes=array([26, 19])
self.n_components=1, self.nTimes=array([26, 19])
self.n_components=1, self.nTimes=array([26, 19])
self.n_components=1, self.nTimes=array([26, 19])
self.n_components=1, self.nTimes=array([26, 19])
self.n_components=1, self.nTimes=array([26, 19])
self.n_components=1, self.nTimes=array([26, 19])
self.n_components=1, self.nTimes=array([26, 19])
self.n_components=1, self.nTimes=array([26, 19])
self.n_components=1, self.nTimes=array([26, 19])
self.n_components=1, self.nTimes=array([26, 19])
self.n_components=1, self.nTimes=array([26, 19])
Model:
mesh:
|   RectilinearMesh2D:
|   Shape: : (79, 133)
|   x
|   RectilinearMesh1D
|   Number of Cells:
|   |   79
|   Cell Centres:
|   |   StatArray
|   |   Name:   Easting (m)
|   |   Address:['0x152b93b50']
|   |   Shape:  (79,)
|   |   Values: [ 0.  1.  2. ... 76. 77. 78.]
|   |   Min:    0.0
|   |   Max:    78.0
|   |   has_posterior: False
|
|   Cell Edges:
|   |   StatArray
|   |   Name:   Easting (m)
|   |   Address:['0x151eb81d0']
|   |   Shape:  (80,)
|   |   Values: [-0.5  0.5  1.5 ... 76.5 77.5 78.5]
|   |   Min:    -0.5
|   |   Max:    78.5
|   |   has_posterior: False
|
|   log:
|   |   None
|   relative_to:
|   |   StatArray
|   |   Name:
|   |   Address:['0x152b92d50']
|   |   Shape:  (1,)
|   |   Values: [0.]
|   |   Min:    0.0
|   |   Max:    0.0
|   |   has_posterior: False
|
|   y
|   RectilinearMesh1D
|   Number of Cells:
|   |   133
|   Cell Centres:
|   |   StatArray
|   |   Name:   elevation (m)
|   |   Address:['0x151eb8350']
|   |   Shape:  (133,)
|   |   Values: [  -2.08834586   -6.26503759  -10.44172932 ... -545.05827068 -549.23496241
|   |    -553.41165414]
|   |   Min:    -553.4116541353383
|   |   Max:    -2.088345864661654
|   |   has_posterior: False
|
|   Cell Edges:
|   |   StatArray
|   |   Name:   elevation (m)
|   |   Address:['0x15158ff50']
|   |   Shape:  (134,)
|   |   Values: [   0.           -4.17669173   -8.35338346 ... -547.14661654 -551.32330827
|   |    -555.5       ]
|   |   Min:    -555.5
|   |   Max:    0.0
|   |   has_posterior: False
|
|   log:
|   |   None
|   relative_to:
|   |   StatArray
|   |   Name:   Elevation (m)
|   |   Address:['0x15158f850']
|   |   Shape:  (79,)
|   |   Values: [0. 0. 0. ... 0. 0. 0.]
|   |   Min:    0.0
|   |   Max:    0.0
|   |   has_posterior: False
|
values:
|   StatArray
|   Name:   Mean Conductivity ($\frac{S}{m}$)
|   Address:['0x152b92050']
|   Shape:  (79, 133)
|   Values: [[1.01806612 1.01806612 1.01805441 ... 0.19009366 0.19046086 0.19046393]
|    [1.03657351 1.03657351 1.03570294 ... 1.18683168 1.18750212 1.18750212]
|    [1.01638097 1.01638097 1.01754131 ... 0.22821797 0.22743062 0.22761428]
|    ...
|    [0.27726717 0.27726717 0.00326359 ... 0.2523025  0.25214303 0.25214303]
|    [0.16168686 0.16168686 0.16168686 ... 0.23802845 0.23802845 0.23802845]
|    [0.14520979 0.14520979 0.00139856 ... 0.00921546 0.00919979 0.00919979]]
|   Min:    0.0006038338330283952
|   Max:    1728.9602499111581
|   has_posterior: False


self.n_components=1, self.nTimes=array([26, 19])
self.n_components=1, self.nTimes=array([26, 19])
self.n_components=1, self.nTimes=array([26, 19])
self.n_components=1, self.nTimes=array([26, 19])
self.n_components=1, self.nTimes=array([26, 19])
self.n_components=1, self.nTimes=array([26, 19])
self.n_components=1, self.nTimes=array([26, 19])
self.n_components=1, self.nTimes=array([26, 19])
self.n_components=1, self.nTimes=array([26, 19])
self.n_components=1, self.nTimes=array([26, 19])
self.n_components=1, self.nTimes=array([26, 19])
self.n_components=1, self.nTimes=array([26, 19])
self.n_components=1, self.nTimes=array([26, 19])
self.n_components=1, self.nTimes=array([26, 19])
self.n_components=1, self.nTimes=array([26, 19])
self.n_components=1, self.nTimes=array([26, 19])
self.n_components=1, self.nTimes=array([26, 19])
self.n_components=1, self.nTimes=array([26, 19])
self.n_components=1, self.nTimes=array([26, 19])
self.n_components=1, self.nTimes=array([26, 19])
self.n_components=1, self.nTimes=array([26, 19])
self.n_components=1, self.nTimes=array([26, 19])
self.n_components=1, self.nTimes=array([26, 19])
self.n_components=1, self.nTimes=array([26, 19])
self.n_components=1, self.nTimes=array([26, 19])
Model:
mesh:
|   RectilinearMesh2D:
|   Shape: : (79, 133)
|   x
|   RectilinearMesh1D
|   Number of Cells:
|   |   79
|   Cell Centres:
|   |   StatArray
|   |   Name:   Easting (m)
|   |   Address:['0x151db5ed0']
|   |   Shape:  (79,)
|   |   Values: [ 0.  1.  2. ... 76. 77. 78.]
|   |   Min:    0.0
|   |   Max:    78.0
|   |   has_posterior: False
|
|   Cell Edges:
|   |   StatArray
|   |   Name:   Easting (m)
|   |   Address:['0x151db4850']
|   |   Shape:  (80,)
|   |   Values: [-0.5  0.5  1.5 ... 76.5 77.5 78.5]
|   |   Min:    -0.5
|   |   Max:    78.5
|   |   has_posterior: False
|
|   log:
|   |   None
|   relative_to:
|   |   StatArray
|   |   Name:
|   |   Address:['0x150e8ee50']
|   |   Shape:  (1,)
|   |   Values: [0.]
|   |   Min:    0.0
|   |   Max:    0.0
|   |   has_posterior: False
|
|   y
|   RectilinearMesh1D
|   Number of Cells:
|   |   133
|   Cell Centres:
|   |   StatArray
|   |   Name:   elevation (m)
|   |   Address:['0x151db4050']
|   |   Shape:  (133,)
|   |   Values: [  -2.08834586   -6.26503759  -10.44172932 ... -545.05827068 -549.23496241
|   |    -553.41165414]
|   |   Min:    -553.4116541353383
|   |   Max:    -2.088345864661654
|   |   has_posterior: False
|
|   Cell Edges:
|   |   StatArray
|   |   Name:   elevation (m)
|   |   Address:['0x152f22350']
|   |   Shape:  (134,)
|   |   Values: [   0.           -4.17669173   -8.35338346 ... -547.14661654 -551.32330827
|   |    -555.5       ]
|   |   Min:    -555.5
|   |   Max:    0.0
|   |   has_posterior: False
|
|   log:
|   |   None
|   relative_to:
|   |   StatArray
|   |   Name:   Elevation (m)
|   |   Address:['0x152b93750']
|   |   Shape:  (79,)
|   |   Values: [0. 0. 0. ... 0. 0. 0.]
|   |   Min:    0.0
|   |   Max:    0.0
|   |   has_posterior: False
|
values:
|   StatArray
|   Name:   Mean Conductivity ($\frac{S}{m}$)
|   Address:['0x151db6350']
|   Shape:  (79, 133)
|   Values: [[0.00057072 0.00057072 0.00056877 ... 0.00217761 0.00215943 0.00211521]
|    [0.00082354 0.00082354 0.0008294  ... 0.00298401 0.00293347 0.00293347]
|    [0.00054038 0.00054038 0.0005437  ... 0.00501624 0.00501549 0.00501855]
|    ...
|    [0.0083681  0.0083681  0.00871023 ... 0.1658159  0.16567791 0.16567791]
|    [0.00946963 0.00946963 0.00949168 ... 0.01082899 0.01148046 0.01150977]
|    [0.00850773 0.00850773 0.00858401 ... 0.00817936 0.00837781 0.00837708]]
|   Min:    0.00035436638709702436
|   Max:    15.596752715337677
|   has_posterior: False


self.n_components=1, self.nTimes=array([26, 19])
self.n_components=1, self.nTimes=array([26, 19])
self.n_components=1, self.nTimes=array([26, 19])
self.n_components=1, self.nTimes=array([26, 19])
self.n_components=1, self.nTimes=array([26, 19])
import argparse
import matplotlib.pyplot as plt
import numpy as np
from geobipy import Model
from geobipy import Inference2D
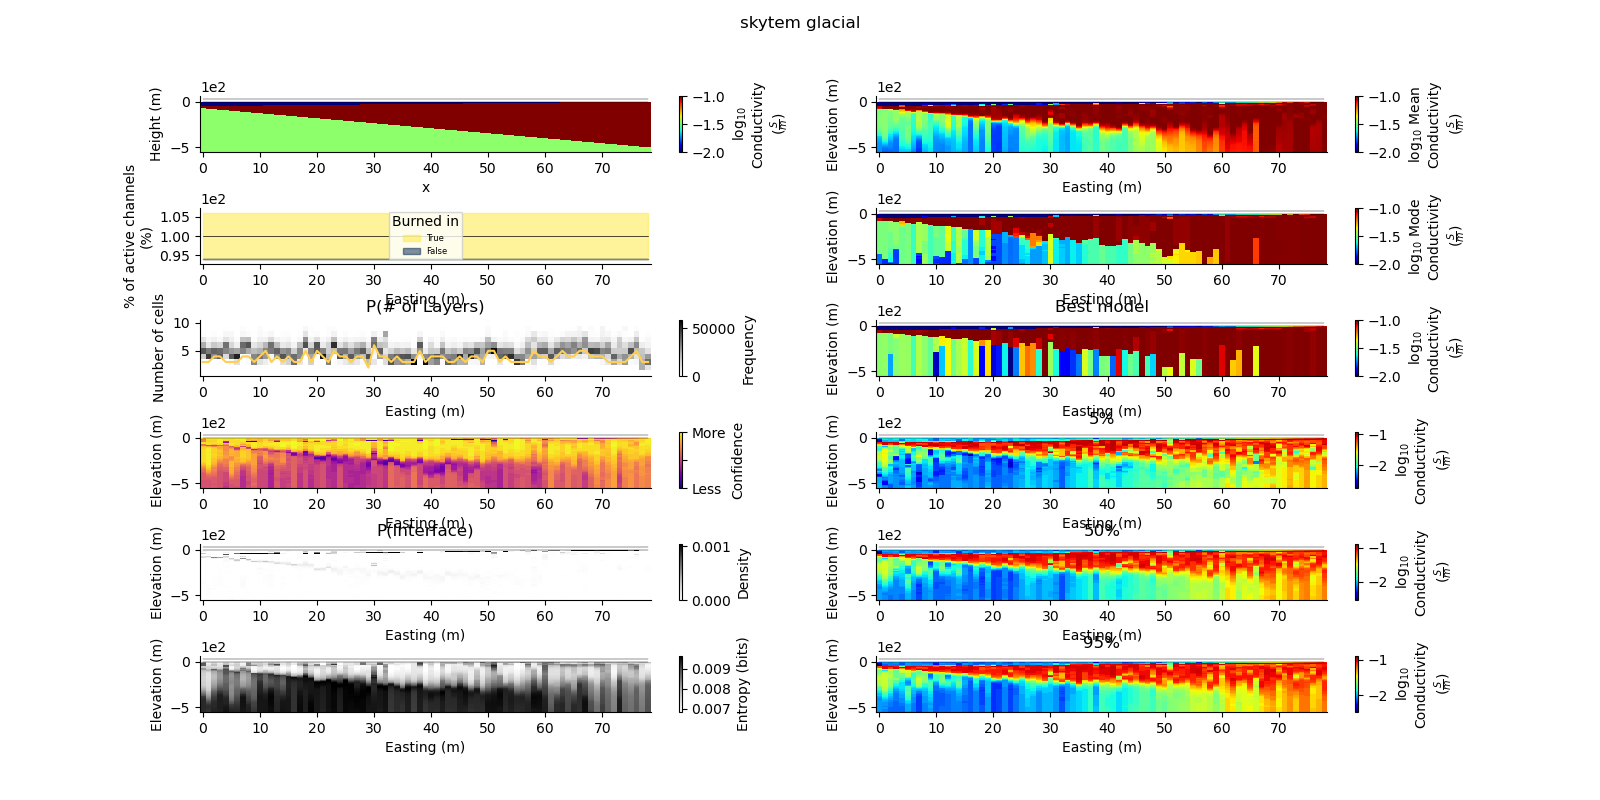
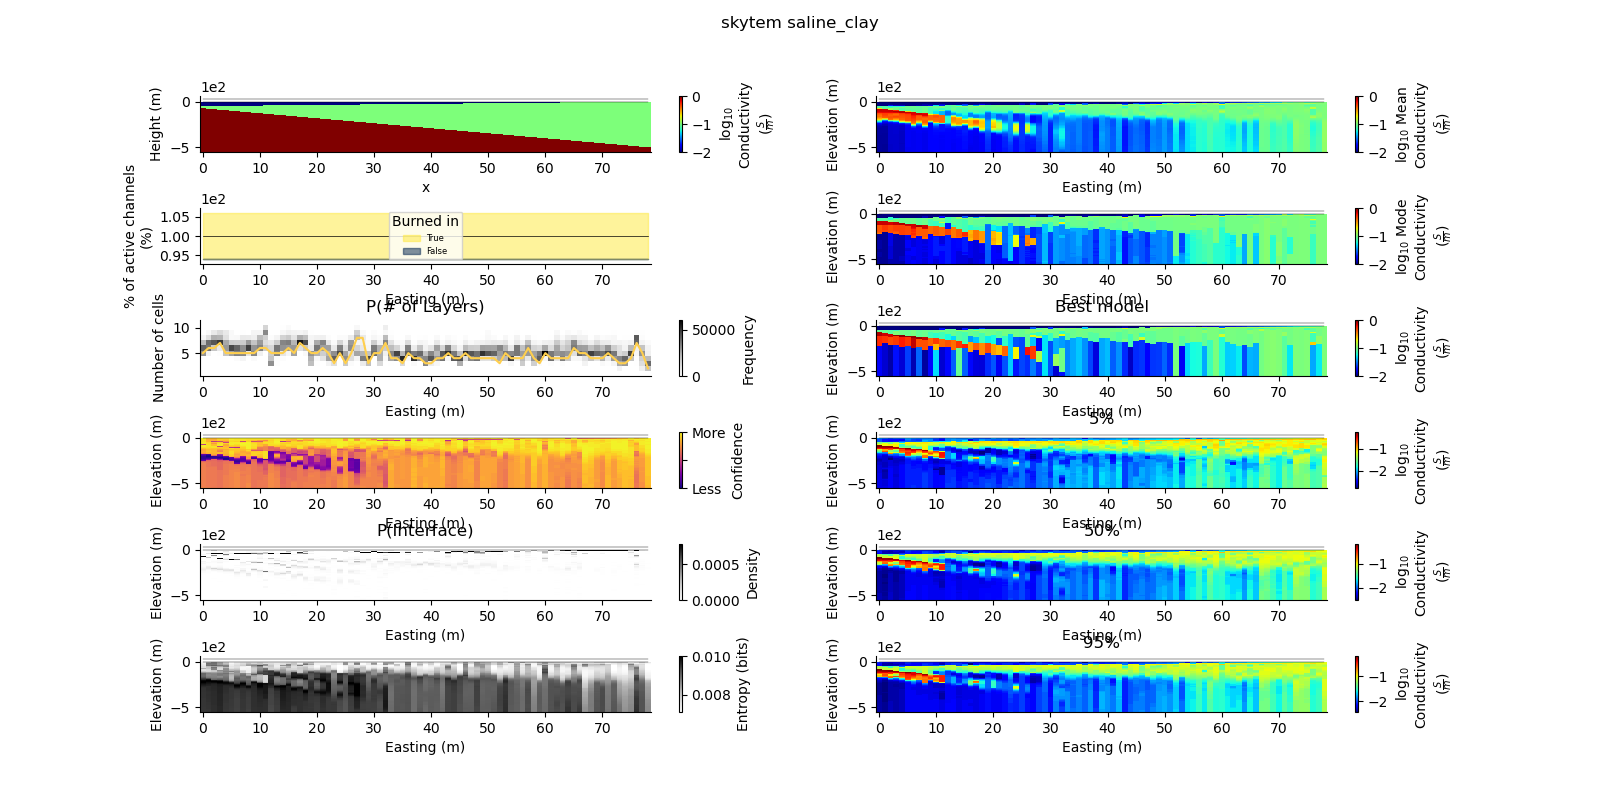
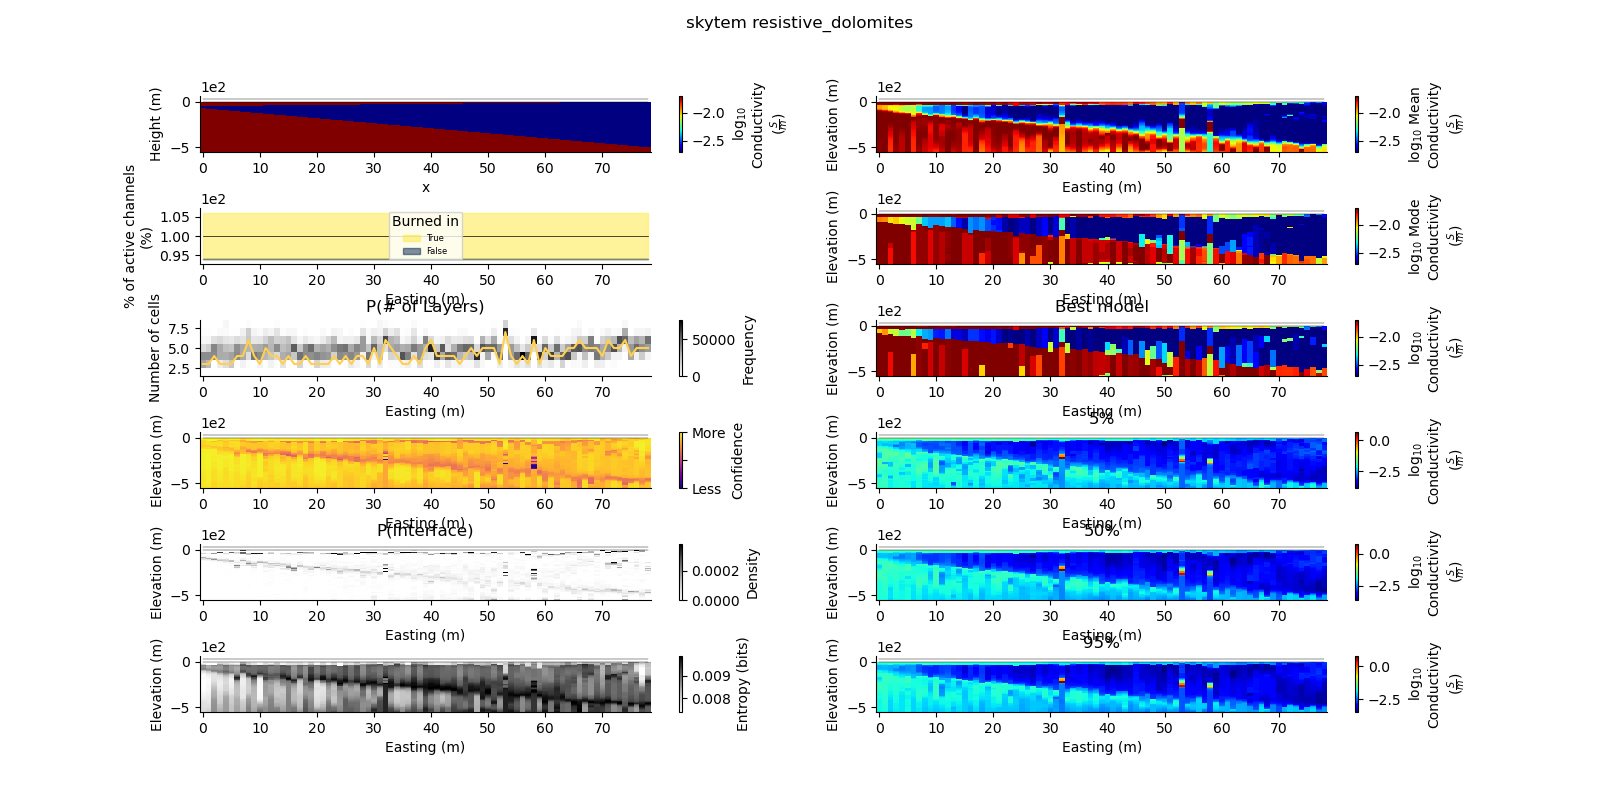
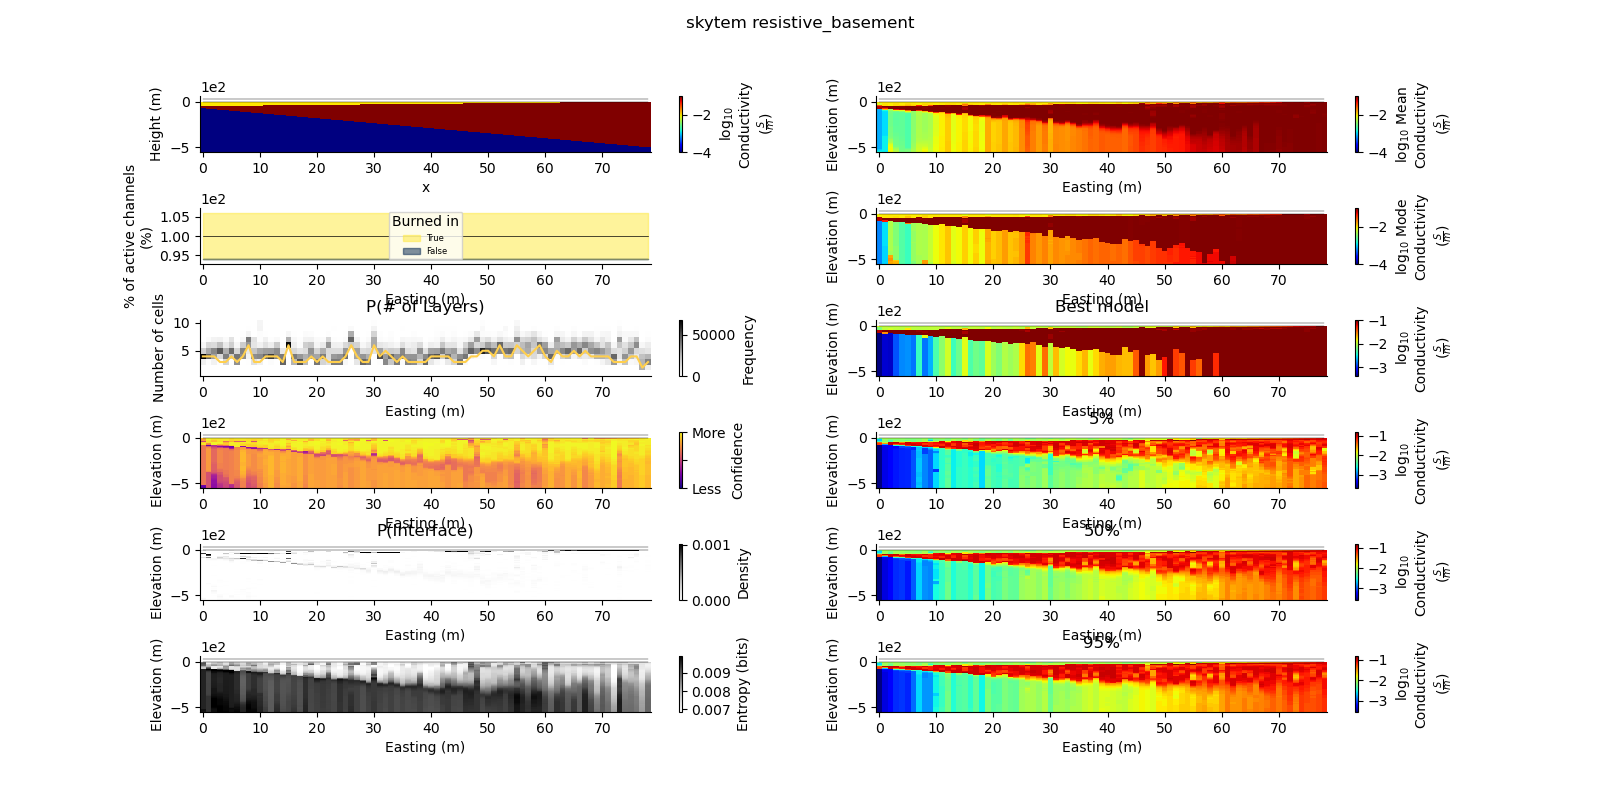
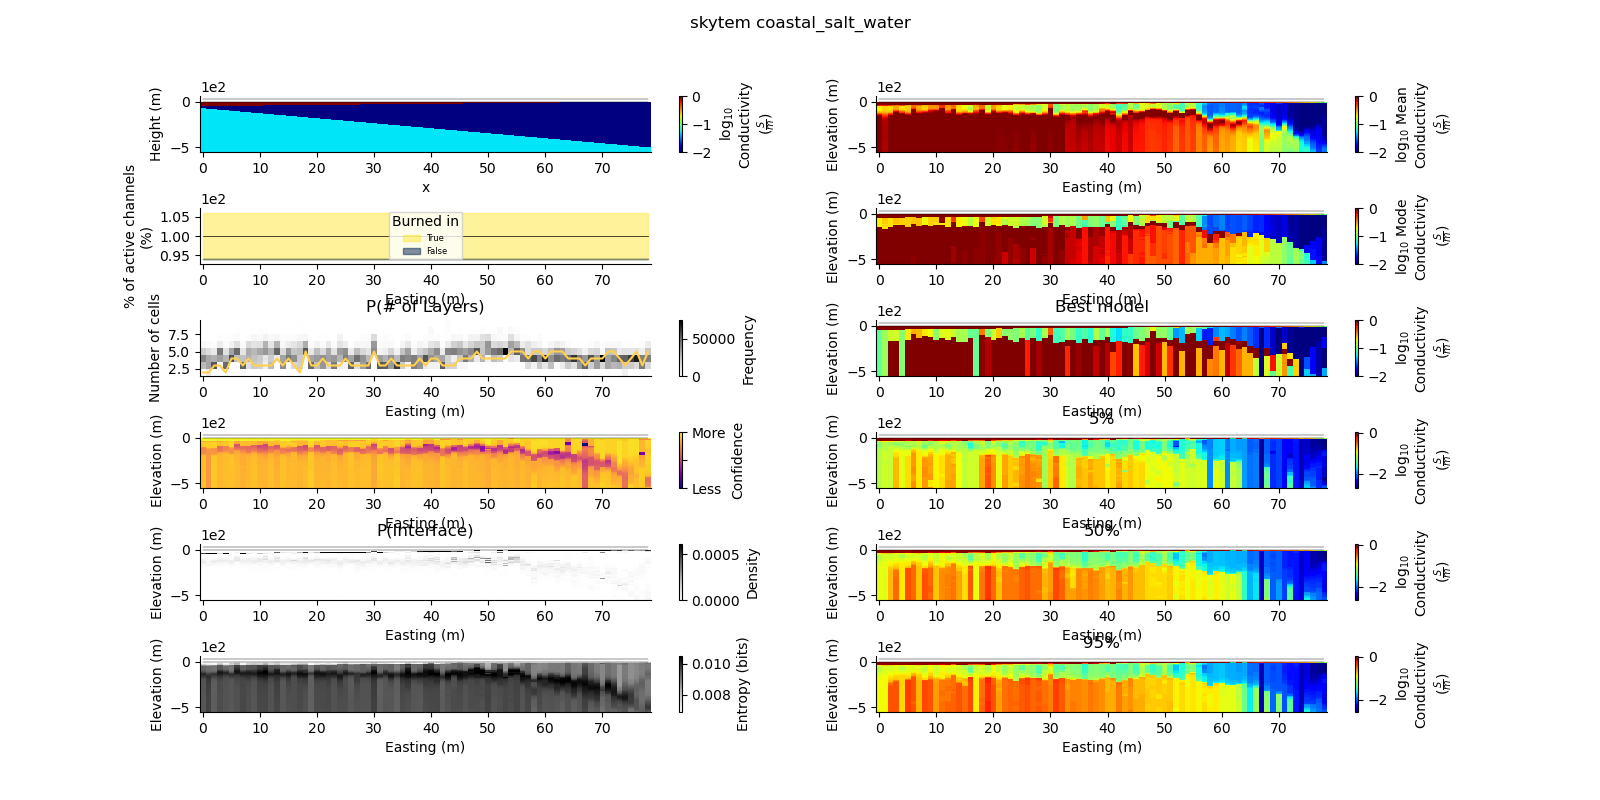
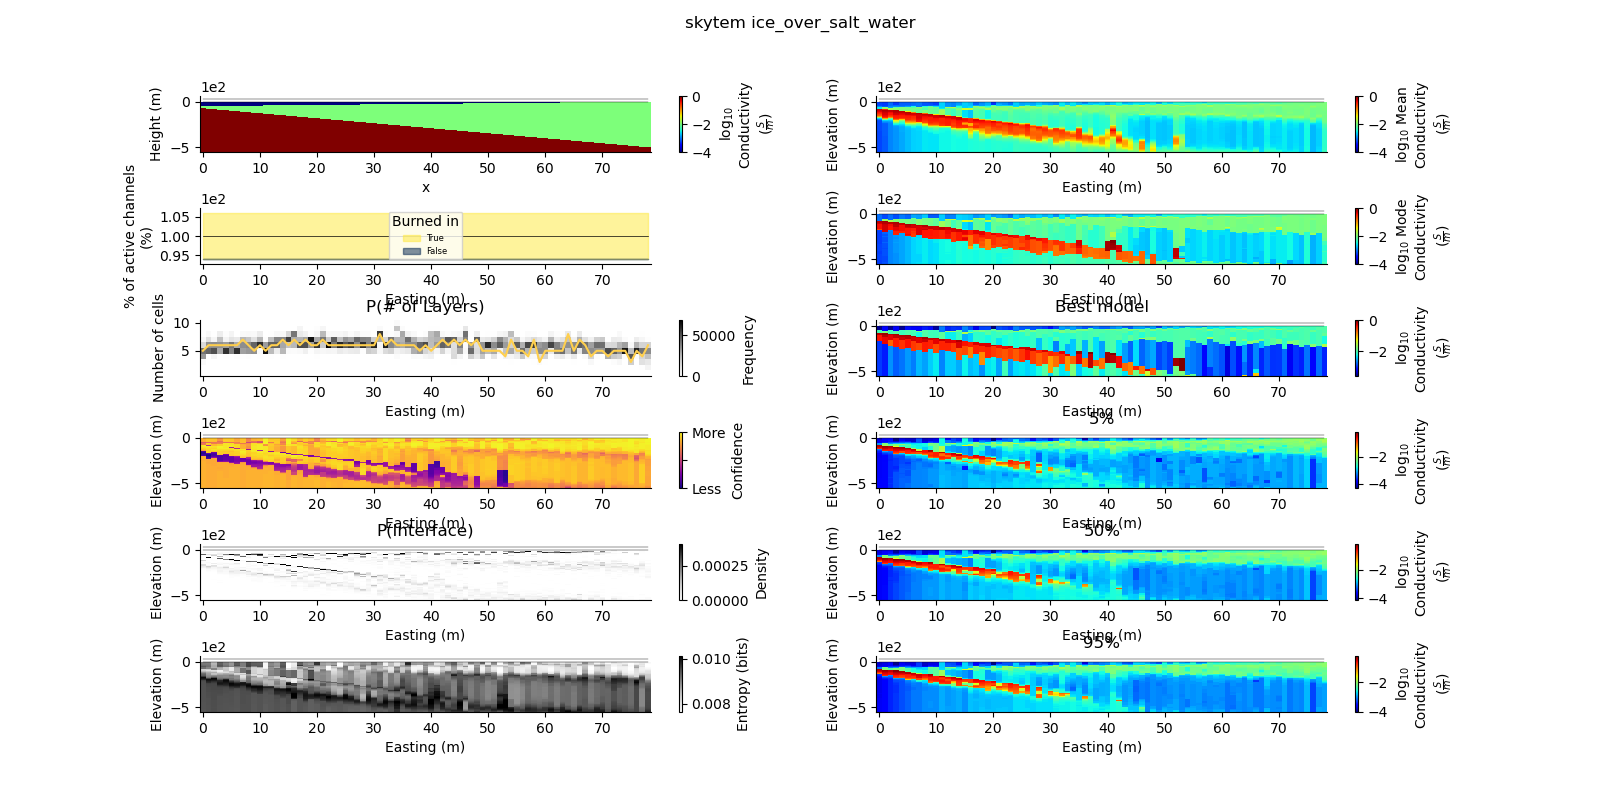
def plot_2d_summary(folder, data_type, model_type):
#%%
# Inference for a line of inferences
# ++++++++++++++++++++++++++++++++++
#
# We can instantiate the inference handler by providing a path to the directory containing
# HDF5 files generated by GeoBIPy.
#
# The InfereceXD classes are low memory. They only read information from the HDF5 files
# as and when it is needed.
#
# The first time you use these classes to create plots, expect longer initial processing times.
# I precompute expensive properties and store them in the HDF5 files for later use.
from numpy.random import Generator
from numpy.random import PCG64DXSM
generator = PCG64DXSM(seed=0)
prng = Generator(generator)
#%%
results_2d = Inference2D.fromHdf('{}/{}/{}/0.0.h5'.format(folder, data_type, model_type), prng=prng)
kwargs = {
"log" : 10,
"cmap" : 'jet'
}
fig = plt.figure(figsize=(16, 8))
plt.suptitle("{} {}".format(data_type, model_type))
gs0 = fig.add_gridspec(6, 2, hspace=1.0)
true_model = Model.create_synthetic_model(model_type)
kwargs['vmin'] = np.log10(np.min(true_model.values))
kwargs['vmax'] = np.log10(np.max(true_model.values))
ax = fig.add_subplot(gs0[0, 0])
true_model.pcolor(flipY=True, ax=ax, wrap_clabel=True, **kwargs)
results_2d.plot_data_elevation(linewidth=0.3, ax=ax, xlabel=False, ylabel=False);
results_2d.plot_elevation(linewidth=0.3, ax=ax, xlabel=False, ylabel=False);
plt.ylim([-550, 60])
print(results_2d.mean_parameters().summary)
ax1 = fig.add_subplot(gs0[0, 1], sharex=ax, sharey=ax)
results_2d.plot_mean_model(ax=ax1, wrap_clabel=True, **kwargs);
results_2d.plot_data_elevation(linewidth=0.3, ax=ax1);
results_2d.plot_elevation(linewidth=0.3, ax=ax1);
# By adding the useVariance keyword, we can make regions of lower confidence more transparent
ax1 = fig.add_subplot(gs0[1, 1], sharex=ax, sharey=ax)
results_2d.plot_mode_model(ax=ax1, wrap_clabel=True, **kwargs);
results_2d.plot_data_elevation(linewidth=0.3, ax=ax1);
results_2d.plot_elevation(linewidth=0.3, ax=ax1);
# # # # # We can also choose to keep parameters above the DOI opaque.
# # # # results_2d.compute_doi()
# # # # plt.subplot(313)
# # # # results_2d.plot_mean_model(use_variance=True, mask_below_doi=True, **kwargs);
# # # # results_2d.plot_data_elevation(linewidth=0.3);
# # # # results_2d.plot_elevation(linewidth=0.3);
ax1 = fig.add_subplot(gs0[2, 1], sharex=ax, sharey=ax)
results_2d.plot_best_model(ax=ax1, wrap_clabel=True, **kwargs);
results_2d.plot_data_elevation(linewidth=0.3, ax=ax1);
results_2d.plot_elevation(linewidth=0.3, ax=ax1);
ax1.set_title('Best model')
del kwargs['vmin']
del kwargs['vmax']
ax1 = fig.add_subplot(gs0[3, 1], sharex=ax, sharey=ax); ax1.set_title('5%')
results_2d.plot_percentile(ax=ax1, percent=0.05, wrap_clabel=True, **kwargs)
results_2d.plot_data_elevation(linewidth=0.3, ax=ax1);
results_2d.plot_elevation(linewidth=0.3, ax=ax1);
ax1 = fig.add_subplot(gs0[4, 1], sharex=ax, sharey=ax); ax1.set_title('50%')
results_2d.plot_percentile(ax=ax1, percent=0.5, wrap_clabel=True, **kwargs)
results_2d.plot_data_elevation(linewidth=0.3, ax=ax1);
results_2d.plot_elevation(linewidth=0.3, ax=ax1);
ax1 = fig.add_subplot(gs0[5, 1], sharex=ax, sharey=ax); ax1.set_title('95%')
results_2d.plot_percentile(ax=ax1, percent=0.95, wrap_clabel=True, **kwargs)
results_2d.plot_data_elevation(linewidth=0.3, ax=ax1);
results_2d.plot_elevation(linewidth=0.3, ax=ax1);
#%%
# We can plot the parameter values that produced the highest posterior
ax1 = fig.add_subplot(gs0[2, 0], sharex=ax)
results_2d.plot_k_layers(ax=ax1, wrap_ylabel=True)
ax1 = fig.add_subplot(gs0[1, 0], sharex=ax)
ll, bb, ww, hh = ax1.get_position().bounds
ax1.set_position([ll, bb, ww*0.8, hh])
results_2d.plot_channel_saturation(ax=ax1, wrap_ylabel=True)
results_2d.plot_burned_in(ax=ax1, underlay=True)
#%%
# Now we can start plotting some more interesting posterior properties.
# How about the confidence?
ax1 = fig.add_subplot(gs0[3, 0], sharex=ax, sharey=ax)
results_2d.plot_confidence(ax=ax1);
results_2d.plot_data_elevation(ax=ax1, linewidth=0.3);
results_2d.plot_elevation(ax=ax1, linewidth=0.3);
#%%
# We can take the interface depth posterior for each data point,
# and display an interface probability cross section
# This posterior can be washed out, so the clim_scaling keyword lets me saturate
# the top and bottom 0.5% of the colour range
ax1 = fig.add_subplot(gs0[4, 0], sharex=ax, sharey=ax)
ax1.set_title('P(Interface)')
results_2d.plot_interfaces(cmap='Greys', clim_scaling=0.5, ax=ax1);
results_2d.plot_data_elevation(linewidth=0.3, ax=ax1);
results_2d.plot_elevation(linewidth=0.3, ax=ax1);
ax1 = fig.add_subplot(gs0[5, 0], sharex=ax, sharey=ax)
results_2d.plot_entropy(cmap='Greys', clim_scaling=0.5, ax=ax1);
results_2d.plot_data_elevation(linewidth=0.3, ax=ax1);
results_2d.plot_elevation(linewidth=0.3, ax=ax1);
# plt.show()
plt.savefig('{}_{}.png'.format(data_type, model_type), dpi=300)
if __name__ == '__main__':
types = ['glacial', 'saline_clay', 'resistive_dolomites', 'resistive_basement', 'coastal_salt_water', 'ice_over_salt_water']
for model in types:
# try:
plot_2d_summary('../../../Parallel_Inference/', "skytem", model)
# except Exception as e:
# print(model)
# print(e)
# pass
Total running time of the script: (0 minutes 21.139 seconds)