Note
Go to the end to download the full example code.
1D Rectilinear Mesh
from copy import deepcopy
from geobipy import DataArray, StatArray
from geobipy import RectilinearMesh1D, RectilinearMesh2D, RectilinearMesh2D_stitched
import matplotlib.gridspec as gridspec
import matplotlib.pyplot as plt
import numpy as np
import h5py
The basics
Instantiate a new 1D rectilinear mesh by specifying cell centres, edges, or widths.
x = StatArray(np.cumsum(np.arange(0.0, 10.0)), 'Depth', 'm')
Cell edges
rm = RectilinearMesh1D(edges=x, centres=None, widths=None)
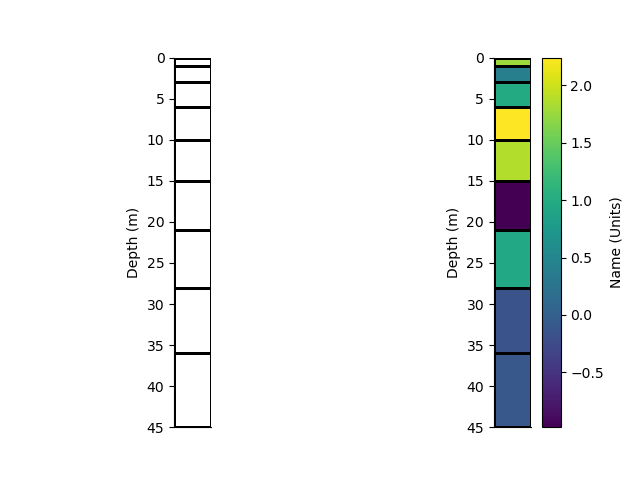
We can plot the grid of the mesh Or Pcolor the mesh showing. An array of cell values is used as the colour.
arr = StatArray(np.random.randn(*rm.shape), "Name", "Units")
p=0; plt.figure(p)
plt.subplot(121)
_ = rm.plot_grid(transpose=True, flip=True)
plt.subplot(122)
_ = rm.pcolor(arr, grid=True, transpose=True, flip=True)

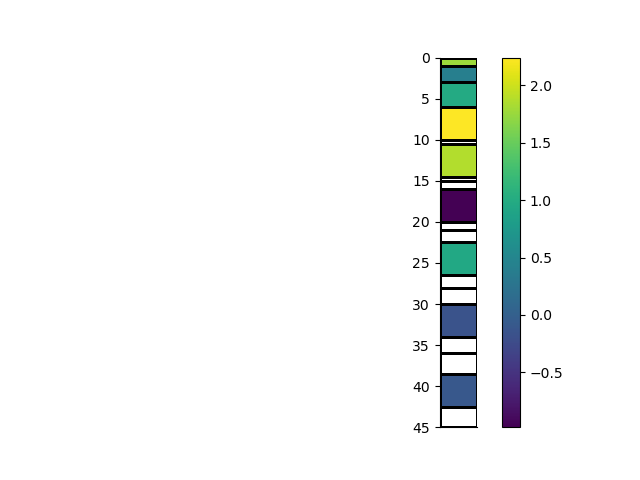
# Mask the mesh cells by a distance
rm_masked, indices, arr2 = rm.mask_cells(2.0, values=arr)
p+=1; plt.figure(p)
_ = rm_masked.pcolor(StatArray(arr2), grid=True, transpose=True, flip=True)

# Writing and reading to/from HDF5
# ++++++++++++++++++++++++++++++++
with h5py.File('rm1d.h5', 'w') as f:
    rm.toHdf(f, 'rm1d')

with h5py.File('rm1d.h5', 'r') as f:
    rm1 = RectilinearMesh1D.fromHdf(f['rm1d'])

p+=1; plt.figure(p)
plt.subplot(121)
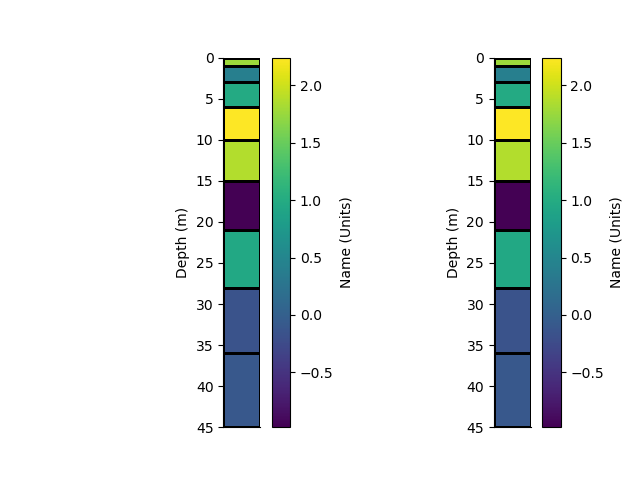
_ = rm.pcolor(StatArray(arr), grid=True, transpose=True, flip=True)
plt.subplot(122)
_ = rm1.pcolor(StatArray(arr), grid=True, transpose=True, flip=True)

with h5py.File('rm1d.h5', 'w') as f:
    rm.createHdf(f, 'rm1d', add_axis=10)
    for i in range(10):
        rm.writeHdf(f, 'rm1d', index=i)

with h5py.File('rm1d.h5', 'r') as f:
    rm1 = RectilinearMesh1D.fromHdf(f['rm1d'], index=0)
with h5py.File('rm1d.h5', 'r') as f:
    rm2 = RectilinearMesh2D.fromHdf(f['rm1d'])

p+=1; plt.figure(p)
plt.subplot(131)
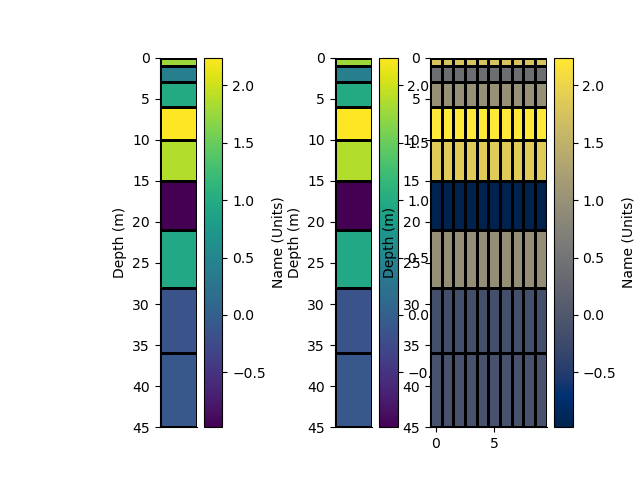
_ = rm.pcolor(StatArray(arr), grid=True, transpose=True, flip=True)
plt.subplot(132)
_ = rm1.pcolor(arr, grid=True, transpose=True, flip=True)
plt.subplot(133)
_ = rm2.pcolor(np.repeat(arr[None, :], 10, 0), grid=True, flipY=True)
Log-space rectilinear mesh
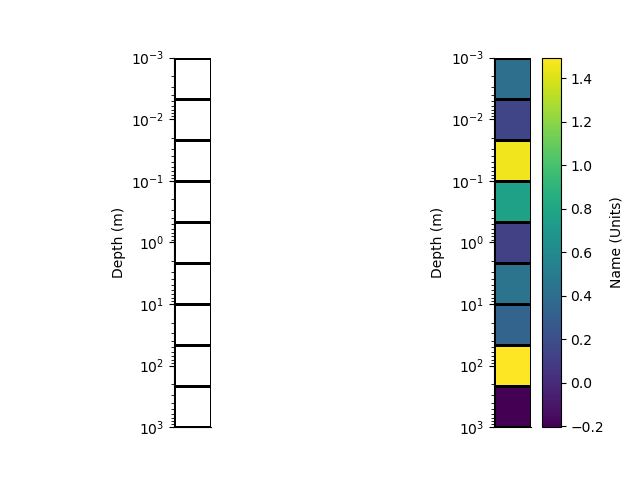
Instantiate a new 1D rectilinear mesh by specifying cell centres or edges. Here we use edges
x = StatArray(np.logspace(-3, 3, 10), 'Depth', 'm')
rm = RectilinearMesh1D(edges=x, log=10)

# We can plot the grid of the mesh
# Or Pcolor the mesh showing. An array of cell values is used as the colour.
p+=1; plt.figure(p)
plt.subplot(121)
_ = rm.plot_grid(transpose=True, flip=True)
plt.subplot(122)
arr = StatArray(np.random.randn(rm.nCells), "Name", "Units")
_ = rm.pcolor(arr, grid=True, transpose=True, flip=True)

# Writing and reading to/from HDF5
# ++++++++++++++++++++++++++++++++
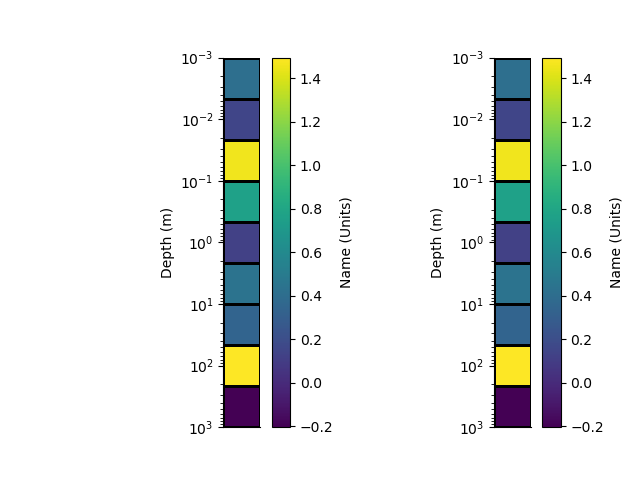
with h5py.File('rm1d.h5', 'w') as f:
    rm.toHdf(f, 'rm1d')

with h5py.File('rm1d.h5', 'r') as f:
    rm1 = RectilinearMesh1D.fromHdf(f['rm1d'])

p+=1; plt.figure(p)
plt.subplot(121)
_ = rm.pcolor(StatArray(arr), grid=True, transpose=True, flip=True)
plt.subplot(122)
_ = rm1.pcolor(StatArray(arr), grid=True, transpose=True, flip=True)

with h5py.File('rm1d.h5', 'w') as f:
    rm.createHdf(f, 'rm1d', add_axis=10)
    for i in range(10):
        rm.writeHdf(f, 'rm1d', index=i)

with h5py.File('rm1d.h5', 'r') as f:
    rm1 = RectilinearMesh1D.fromHdf(f['rm1d'], index=0)
with h5py.File('rm1d.h5', 'r') as f:
    rm2 = RectilinearMesh2D.fromHdf(f['rm1d'])

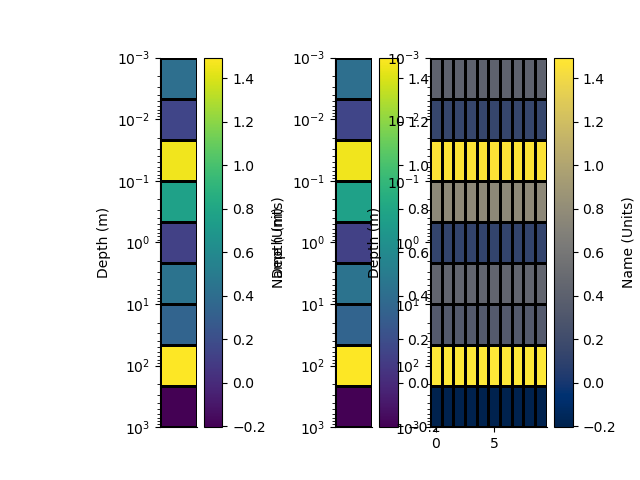
p+=1; plt.figure(p)
plt.subplot(131)
_ = rm.pcolor(StatArray(arr), grid=True, transpose=True, flip=True)
plt.subplot(132)
_ = rm1.pcolor(arr, grid=True, transpose=True, flip=True)
plt.subplot(133)
_ = rm2.pcolor(np.repeat(arr[None, :], 10, 0), grid=True, flipY=True)
relative_to
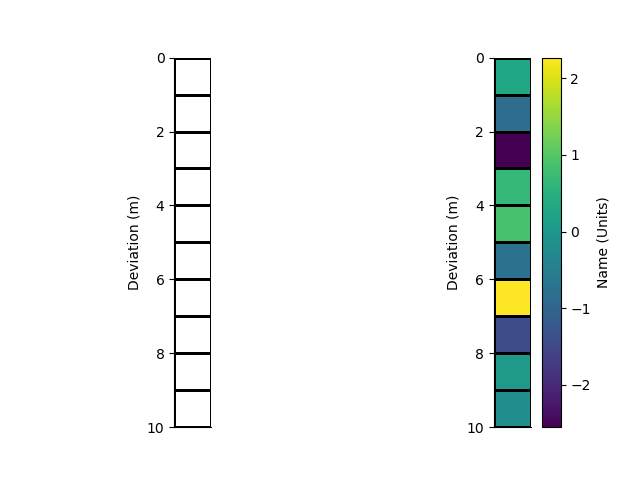
Instantiate a new 1D rectilinear mesh by specifying cell centres or edges. Here we use edges
x = StatArray(np.arange(11.0), 'Deviation', 'm')
rm = RectilinearMesh1D(edges=x, relative_to=5.0)
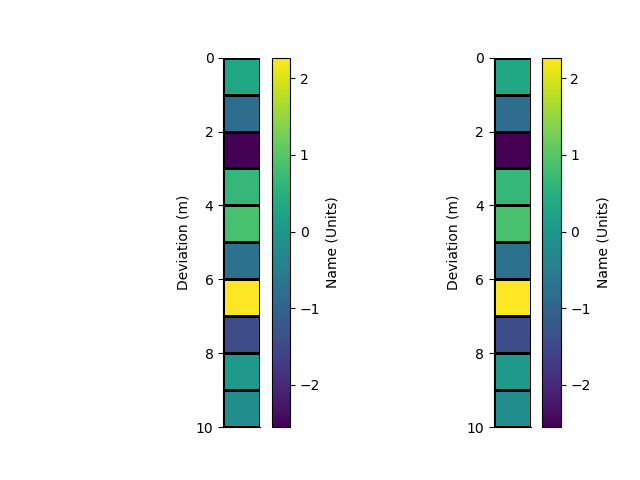
We can plot the grid of the mesh Or Pcolor the mesh showing. An array of cell values is used as the colour.
p+=1; plt.figure(p)
plt.subplot(121)
_ = rm.plot_grid(transpose=True, flip=True)
plt.subplot(122)
arr = StatArray(np.random.randn(rm.nCells), "Name", "Units")
_ = rm.pcolor(arr, grid=True, transpose=True, flip=True)

# Writing and reading to/from HDF5
# ++++++++++++++++++++++++++++++++
with h5py.File('rm1d.h5', 'w') as f:
    rm.createHdf(f, 'rm1d')
    rm.writeHdf(f, 'rm1d')

with h5py.File('rm1d.h5', 'r') as f:
    rm1 = RectilinearMesh1D.fromHdf(f['rm1d'])

p+=1; plt.figure(p)
plt.subplot(121)
_ = rm.pcolor(StatArray(arr), grid=True, transpose=True, flip=True)
plt.subplot(122)
_ = rm1.pcolor(StatArray(arr), grid=True, transpose=True, flip=True)

with h5py.File('rm1d.h5', 'w') as f:
    rm.createHdf(f, 'rm1d', add_axis=3)
    for i in range(3):
        rm.relative_to += 0.5
        rm.writeHdf(f, 'rm1d', index=i)

with h5py.File('rm1d.h5', 'r') as f:
    rm1 = RectilinearMesh1D.fromHdf(f['rm1d'], index=0)
with h5py.File('rm1d.h5', 'r') as f:
    rm2 = RectilinearMesh2D.fromHdf(f['rm1d'])

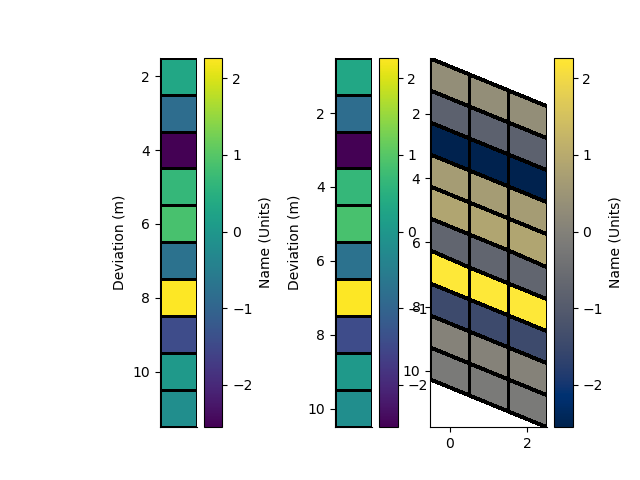
p+=1; plt.figure(p)
plt.subplot(131)
_ = rm.pcolor(StatArray(arr), grid=True, transpose=True, flip=True)
plt.subplot(132)
_ = rm1.pcolor(arr, grid=True, transpose=True, flip=True)
plt.subplot(133)
_ = rm2.pcolor(np.repeat(arr[None, :], 3, 0), grid=True, flipY=True)


# Making a mesh perturbable
# +++++++++++++++++++++++++
n_cells = 2
widths = DataArray(np.full(n_cells, fill_value=10.0), 'test')
rm = RectilinearMesh1D(widths=widths, relative_to=0.0)
Randomness and Model Perturbations
We can set the priors on the 1D model by assigning minimum and maximum layer depths and a maximum number of layers. These are used to create priors on the number of cells in the model, a new depth interface, new parameter values and the vertical gradient of those parameters. The halfSpaceValue is used as a reference value for the parameter prior.
from numpy.random import Generator
from numpy.random import PCG64DXSM
generator = PCG64DXSM(seed=0)
prng = Generator(generator)

# Set the priors
rm.set_priors(min_edge = 1.0,
              max_edge = 150.0,
              max_cells = 30,
              prng = prng)
We can evaluate the prior of the model using depths only
print('Log probability of the Mesh given its priors: ', rm.probability)
Log probability of the Mesh given its priors: -3.367295829986474
To propose new meshes, we specify the probabilities of creating, removing, perturbing, and not changing an edge interface Here we force the creation of a layer.
rm.set_proposals(probabilities = [0.25, 0.25, 0.25, 0.25], prng=prng)
rm.set_posteriors()

rm0 = deepcopy(rm)
We can then perturb the layers of the model
for i in range(1000):
    rm = rm.perturb()
    rm.update_posteriors()
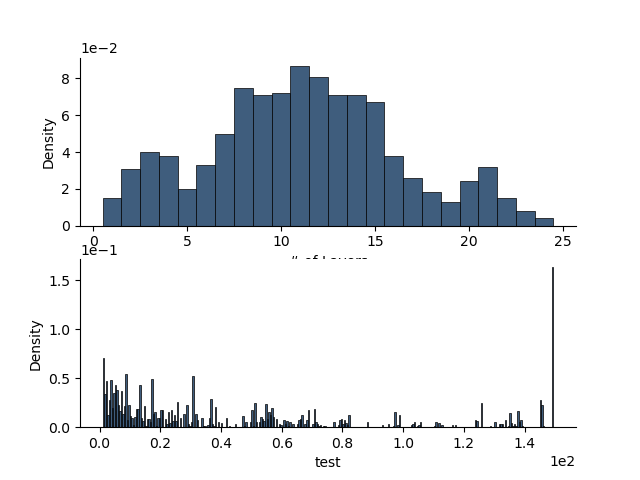
p+=1; fig = plt.figure(p)
ax = rm._init_posterior_plots(fig)

rm.plot_posteriors(axes=ax)

with h5py.File('rm1d.h5', 'w') as f:
    rm.createHdf(f, 'rm1d', withPosterior = True)
    rm.writeHdf(f, 'rm1d', withPosterior = True)

with h5py.File('rm1d.h5', 'r') as f:
    rm1 = RectilinearMesh1D.fromHdf(f['rm1d'])

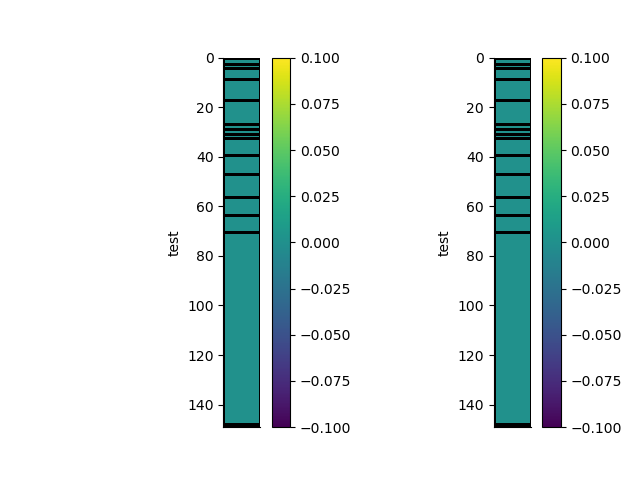
p+=1; plt.figure(p)
plt.subplot(121)
_ = rm.pcolor(StatArray(rm.shape), grid=True, transpose=True, flip=True)
plt.subplot(122)
_ = rm1.pcolor(StatArray(rm1.shape), grid=True, transpose=True, flip=True)

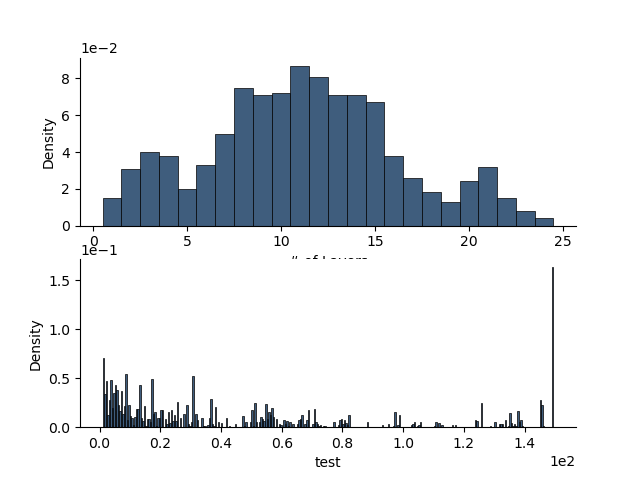
p+=1; fig = plt.figure(p)
ax = rm1._init_posterior_plots(fig)
rm1.plot_posteriors(axes=ax)
[<Axes: xlabel='# of Layers', ylabel='Density'>, <Axes: xlabel='test', ylabel='Density'>]
Expanded
with h5py.File('rm1d.h5', 'w') as f:
    tmp = rm.pad(rm.max_cells)
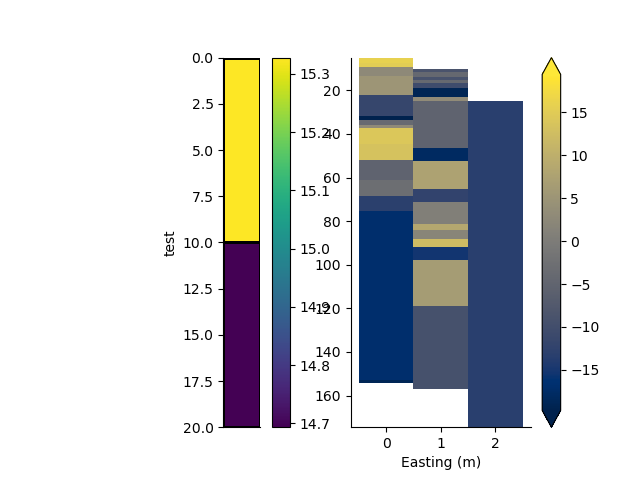
    tmp.createHdf(f, 'rm1d', withPosterior=True, add_axis=DataArray(np.arange(3.0), name='Easting', units="m"))

    print(list(f['rm1d'].keys()))

    rm.relative_to = 5.0
    print(rm.summary)
    rm.writeHdf(f, 'rm1d', withPosterior = True, index=0)

    rm = deepcopy(rm0)
    for i in range(1000):
        rm = rm.perturb(); rm.update_posteriors()
    rm.relative_to = 10.0
    rm.writeHdf(f, 'rm1d', withPosterior = True, index=1)

    rm = deepcopy(rm0)
    for i in range(1000):
        rm = rm.perturb(); rm.update_posteriors()
    rm.relative_to = 25.0
    rm.writeHdf(f, 'rm1d', withPosterior = True, index=2)

with h5py.File('rm1d.h5', 'r') as f:
    rm2 = RectilinearMesh2D.fromHdf(f['rm1d'])

p+=1; plt.figure(p)
plt.subplot(121)
arr = np.random.randn(3, rm.max_cells) * 10
_ = rm0.pcolor(arr[0, :rm0.nCells.item()], grid=True, transpose=True, flip=True)
plt.subplot(122)
_ = rm2.pcolor(arr, grid=True, flipY=True, equalize=True)

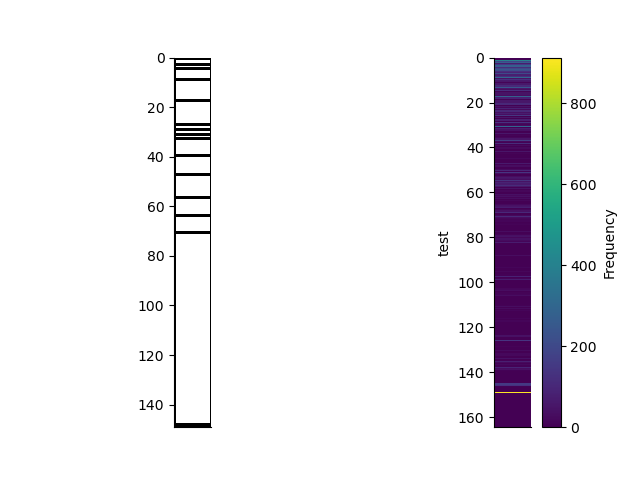
from geobipy import RectilinearMesh2D
with h5py.File('rm1d.h5', 'r') as f:
    rm2 = RectilinearMesh2D.fromHdf(f['rm1d'], index=0)

plt.figure()
plt.subplot(121)
rm2.plot_grid(transpose=True, flip=True)
plt.subplot(122)
rm2.edges.posterior.pcolor(transpose=True, flip=True)

plt.show()
['nCells', 'x', 'y']
RectilinearMesh1D
Number of Cells:
|   StatArray
|   Name:   Number of cells
|   Address:['0x15dfbb9d0' '0x15d9b10a0' '0x15e28ec10' '0x15e28dc50']
|   Shape:  (1,)
|   Values: [15]
|   Min:    15
|   Max:    15
|   Prior:
|   |   Uniform Distribution:
|   |   Min: 1
|   |   Max: 30
|   has_posterior: True

Cell Centres:
|   StatArray
|   Name:   test
|   Address:['0x15dc850d0']
|   Shape:  (15,)
|   Values: [  1.22331766   3.28906551   6.36608642 ...  66.85590133 108.99206549
|    148.449825  ]
|   Min:    1.2233176602046558
|   Max:    148.4498250024555
|   has_posterior: False

Cell Edges:
|   StatArray
|   Name:   test
|   Address:['0x155de5e50' '0x15d8381a0' '0x15e28f7b0' '0x153d89c10' '0x15d811b50'
|    '0x15d810af0']
|   Shape:  (16,)
|   Values: [  0.           2.44663532   4.13149571 ...  70.19008745 147.79404353
|    149.10560647]
|   Min:    0.0
|   Max:    149.1056064716983
|   Prior:
|   |   Order Statistics:
|   |   None
|   Proposal:
|   |   Uniform Distribution:
|   |   Min: 1.0
|   |   Max: 149.99999999999997
|   has_posterior: True

log:
|   None
relative_to:
|   StatArray
|   Name:
|   Address:['0x15e0e7ed0']
|   Shape:  (1,)
|   Values: [5.]
|   Min:    5.0
|   Max:    5.0
|   has_posterior: False
Total running time of the script: (0 minutes 4.760 seconds)
