Note
Go to the end to download the full example code.
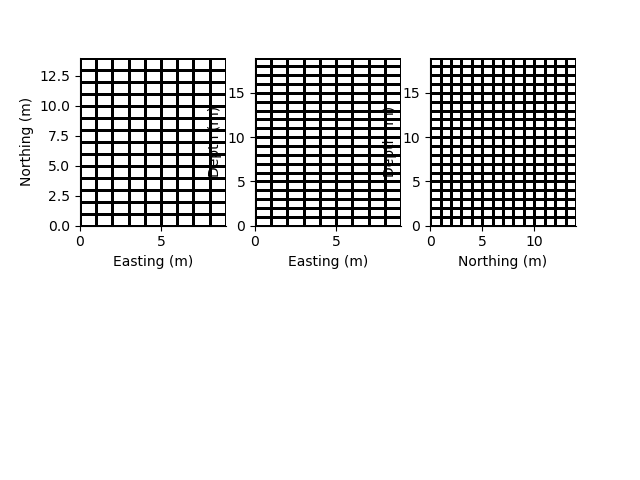
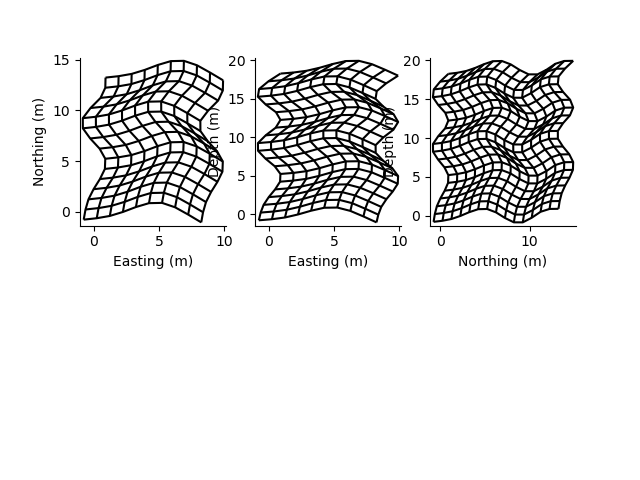
3D Rectilinear Mesh
This 3D rectilinear mesh defines a grid with straight cell boundaries.
from geobipy import StatArray
from geobipy import RectilinearMesh3D
import matplotlib.pyplot as plt
import numpy as np
import h5py
Specify some cell centres in x and y
x = StatArray(np.arange(10.0), 'Easting', 'm')
y = StatArray(np.arange(15.0), 'Northing', 'm')
z = StatArray(np.arange(20.0), 'Depth', 'm')

rm = RectilinearMesh3D(x_edges=x, y_edges=y, z_edges=z)

rm1 = rm[:5, :5, :5]
rm2 = rm[:, :, 5]
rm3 = rm[:, 5, :]
rm4 = rm[5, :, :]

plt.figure()
plt.subplot(231)
rm2.plot_grid()
plt.subplot(232)
rm3.plot_grid()
plt.subplot(233)
rm4.plot_grid()
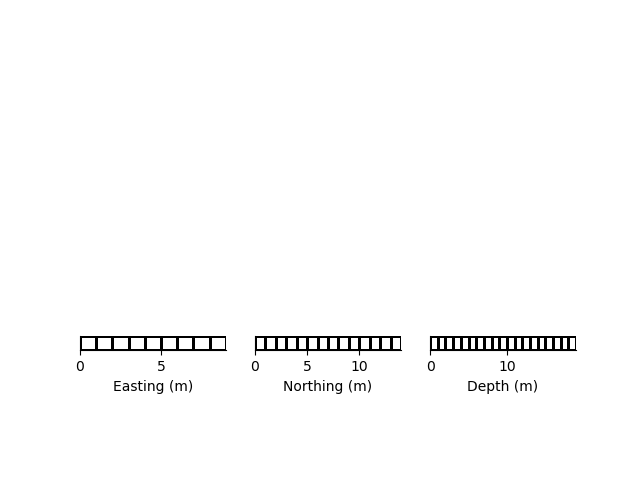
rm2 = rm[:, 5, 5]
rm3 = rm[5, :, 5]
rm4 = rm[5, 5, :]

plt.subplot(234)
rm2.plot_grid()
plt.subplot(235)
rm3.plot_grid()
plt.subplot(236)
rm4.plot_grid()
with h5py.File('rm3d.h5', 'w') as f:
rm.createHdf(f, 'test')
rm.writeHdf(f, 'test')
with h5py.File('rm3d.h5', 'r') as f:
rm2 = RectilinearMesh3D.fromHdf(f['test'])
rm.pyvista_mesh().save('rm3d.vtk')
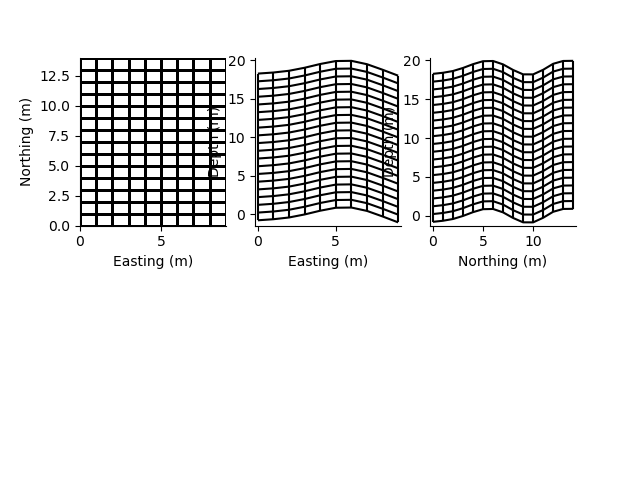
xx, yy = np.meshgrid(rm.y.centres, rm.x.centres)
z_re = StatArray(np.sin(np.sqrt(xx ** 2.0 + yy ** 2.0)), "z_re")
rm = RectilinearMesh3D(x_edges=x, y_edges=y, z_edges=z, z_relative_to=z_re)
rm1 = rm[:5, :5, :5]
rm2 = rm[:, :, 5]
rm3 = rm[:, 5, :]
rm4 = rm[5, :, :]
plt.figure()
plt.subplot(231)
rm2.plot_grid()
plt.subplot(232)
rm3.plot_grid()
plt.subplot(233)
rm4.plot_grid()
We can plot the mesh in 3D!
pv = rm.pyvista_plotter()
We can plot the mesh in 3D!
mesh = rm.pyvista_mesh().save('rm3d_re1.vtk')
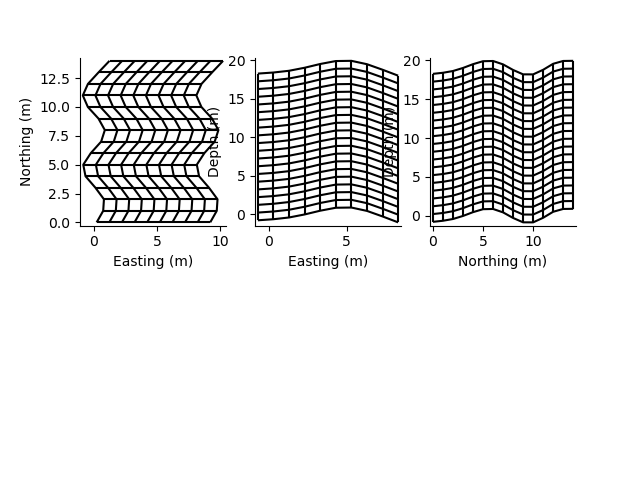
x_re = StatArray(np.sin(np.repeat(rm.y.centres[:, None], rm.z.nCells, 1)), "x_re")
xx, yy = np.meshgrid(rm.y.centres, rm.x.centres)
z_re = StatArray(np.sin(np.sqrt(xx ** 2.0 + yy ** 2.0)), "z_re")
rm = RectilinearMesh3D(x_edges=x, x_relative_to=x_re, y_edges=y, z_edges=z, z_relative_to=z_re)
rm1 = rm[:5, :5, :5]
rm2 = rm[:, :, 5]
rm3 = rm[:, 5, :]
rm4 = rm[5, :, :]
plt.figure()
plt.subplot(231)
rm2.plot_grid()
plt.subplot(232)
rm3.plot_grid()
plt.subplot(233)
rm4.plot_grid()
We can plot the mesh in 3D!
pv = rm.pyvista_plotter()
We can plot the mesh in 3D!
mesh = rm.pyvista_mesh().save('rm3d_re2.vtk')


xx, yy = np.meshgrid(rm.z.centres, rm.y.centres)
x_re = StatArray(np.sin(np.sqrt(xx ** 2.0 + yy ** 2.0)), "x_re")

xx, yy = np.meshgrid(rm.z.centres, rm.x.centres)
y_re = StatArray(np.sin(np.sqrt(xx ** 2.0 + yy ** 2.0)), "y_re")

xx, yy = np.meshgrid(rm.y.centres, rm.x.centres)
z_re = StatArray(np.sin(np.sqrt(xx ** 2.0 + yy ** 2.0)), "z_re")
rm = RectilinearMesh3D(x_edges=x, x_relative_to=x_re, y_edges=y, y_relative_to=y_re, z_edges=z, z_relative_to=z_re)

rm1 = rm[:5, :5, :5]
rm2 = rm[:, :, 5]
rm3 = rm[:, 5, :]
rm4 = rm[5, :, :]

plt.figure()
plt.subplot(231)
rm2.plot_grid()
plt.subplot(232)
rm3.plot_grid()
plt.subplot(233)
rm4.plot_grid()
We can plot the mesh in 3D!
pv = rm.pyvista_plotter()
We can plot the mesh in 3D!
mesh = rm.pyvista_mesh().save('rm3d_re3.vtk')

with h5py.File('rm3d.h5', 'w') as f:
    rm.toHdf(f, 'test')

with h5py.File('rm3d.h5', 'r') as f:
    rm2 = RectilinearMesh3D.fromHdf(f['test'])

rm2.pyvista_mesh().save('rm3d_read.vtk')

plt.show()
Total running time of the script: (0 minutes 0.824 seconds)