Note
Go to the end to download the full example code.
3D Rectilinear Model
This 3D rectilinear model defines a grid with straight cell boundaries.
from geobipy import StatArray
from geobipy import RectilinearMesh3D
from geobipy import Model
import matplotlib.pyplot as plt
import numpy as np
import h5py


"""
3D Rectilinear Mesh
-------------------
This 3D rectilinear mesh defines a grid with straight cell boundaries.

"""
'\n3D Rectilinear Mesh\n-------------------\nThis 3D rectilinear mesh defines a grid with straight cell boundaries.\n\n'
from geobipy import StatArray
from geobipy import RectilinearMesh3D
from geobipy import Model
import matplotlib.pyplot as plt
import numpy as np
import h5py
Specify some cell centres in x and y
x = StatArray(np.arange(10.0), 'Easting', 'm')
y = StatArray(np.arange(15.0), 'Northing', 'm')
z = StatArray(np.arange(20.0), 'Depth', 'm')

mesh = RectilinearMesh3D(x_edges=x, y_edges=y, z_edges=z)

xx, yy = np.meshgrid(mesh.y.centres, mesh.x.centres)
values = StatArray(np.sin(np.sqrt(xx ** 2.0 + yy ** 2.0)), "Height")
values = np.repeat(values[:, :, None], mesh.z.nCells, 2)

model = Model(mesh=mesh, values=values)

model1 = model[:5, :5, :5]
model2 = model[:, :, 5]
model3 = model[:, 5, :]
model4 = model[5, :, :]

plt.figure()
plt.subplot(231)
model2.pcolor()
plt.subplot(232)
model3.pcolor()
plt.subplot(233)
model4.pcolor()
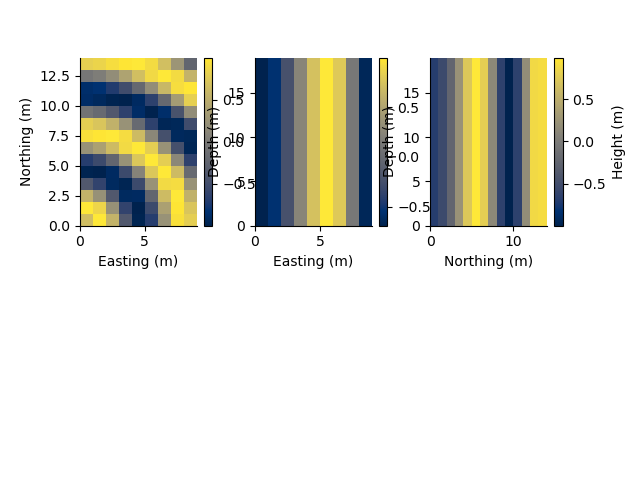
(<Axes: xlabel='Northing (m)', ylabel='Depth (m)'>, <matplotlib.collections.QuadMesh object at 0x15d99d2e0>, <matplotlib.colorbar.Colorbar object at 0x155dbc5f0>)
model2 = model[:, 5, 5]
model3 = model[5, :, 5]
model4 = model[5, 5, :]

plt.subplot(234)
model2.pcolor()
plt.subplot(235)
model3.pcolor()
plt.subplot(236)
model4.pcolor()
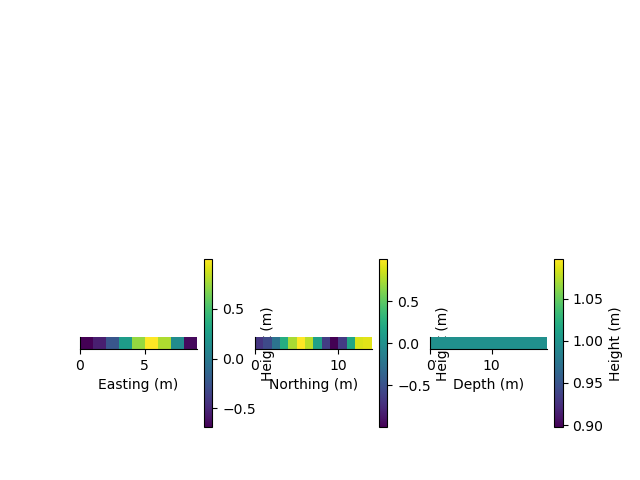
<Axes: xlabel='Depth (m)'>
with h5py.File('model3d.h5', 'w') as f:
    model.createHdf(f, 'test')
    model.writeHdf(f, 'test')

with h5py.File('model3d.h5', 'r') as f:
    model2 = Model.fromHdf(f['test'])

model.pyvista_mesh().save('model3d.vtk')


xx, yy = np.meshgrid(mesh.y.centres, mesh.x.centres)
z_re = StatArray(np.sin(np.sqrt(xx ** 2.0 + yy ** 2.0)), "z_re")
mesh = RectilinearMesh3D(x_edges=x, y_edges=y, z_edges=z, z_relative_to=z_re)
model = Model(mesh=mesh, values=values)

model1 = model[:5, :5, :5]
model2 = model[:, :, 5]
model3 = model[:, 5, :]
model4 = model[5, :, :]

plt.figure()
plt.subplot(231)
model2.pcolor()
plt.subplot(232)
model3.pcolor()
plt.subplot(233)
model4.pcolor()
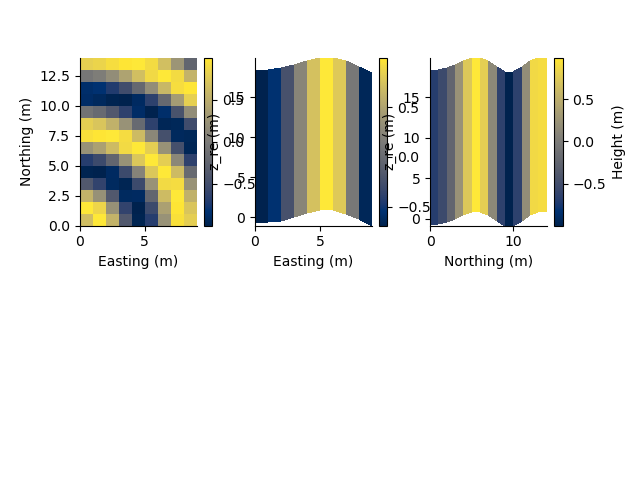
(<Axes: xlabel='Northing (m)', ylabel='z_re (m)'>, <matplotlib.collections.QuadMesh object at 0x15e1831d0>, <matplotlib.colorbar.Colorbar object at 0x15d956120>)
We can plot the mesh in 3D!
pv = model.pyvista_plotter()
We can plot the mesh in 3D!
model.pyvista_mesh().save('model3d_re1.vtk')


x_re = StatArray(np.sin(np.repeat(mesh.y.centres[:, None], mesh.z.nCells, 1)), "x_re")
mesh = RectilinearMesh3D(x_edges=x, x_relative_to=x_re, y_edges=y, z_edges=z, z_relative_to=z_re)
model = Model(mesh=mesh, values=values)

model1 = model[:5, :5, :5]
model2 = model[:, :, 5]
model3 = model[:, 5, :]
model4 = model[5, :, :]

plt.figure()
plt.subplot(231)
model2.pcolor()
plt.subplot(232)
model3.pcolor()
plt.subplot(233)
model4.pcolor()
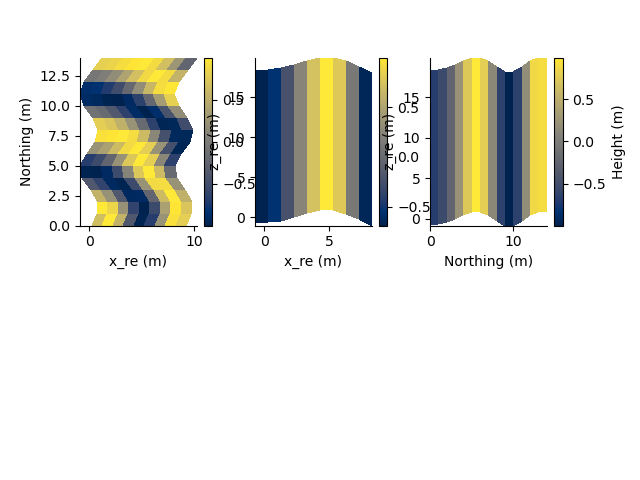
(<Axes: xlabel='Northing (m)', ylabel='z_re (m)'>, <matplotlib.collections.QuadMesh object at 0x155dd1880>, <matplotlib.colorbar.Colorbar object at 0x15e0c1a60>)
We can plot the mesh in 3D!
pv = model.pyvista_plotter()
We can plot the mesh in 3D!
model.pyvista_mesh().save('model3d_re2.vtk')


xx, yy = np.meshgrid(mesh.z.centres, mesh.x.centres)
y_re = StatArray(np.sin(np.sqrt(xx ** 2.0 + yy ** 2.0)), "y_re")

mesh = RectilinearMesh3D(x_edges=x, x_relative_to=x_re, y_edges=y, y_relative_to=y_re, z_edges=z, z_relative_to=z_re)
model = Model(mesh=mesh, values=values)

model1 = model[:5, :5, :5]
model2 = model[:, :, 5]
model3 = model[:, 5, :]
model4 = model[5, :, :]

plt.figure()
plt.subplot(231)
model2.pcolor()
plt.subplot(232)
model3.pcolor()
plt.subplot(233)
model4.pcolor()
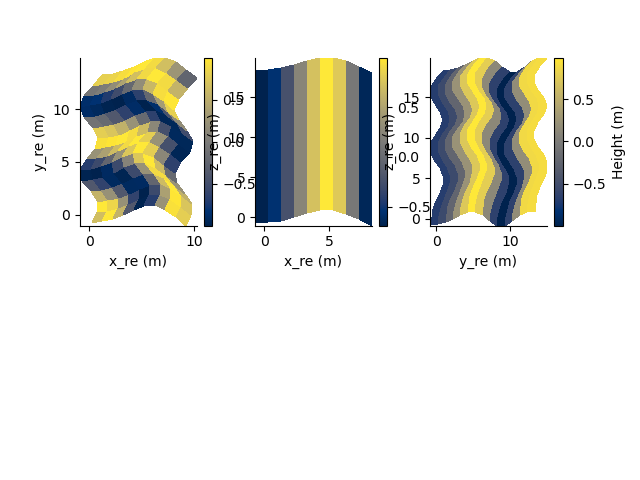
(<Axes: xlabel='y_re (m)', ylabel='z_re (m)'>, <matplotlib.collections.QuadMesh object at 0x153d111f0>, <matplotlib.colorbar.Colorbar object at 0x15e378e90>)
We can plot the mesh in 3D!
pv = model.pyvista_plotter()
We can plot the mesh in 3D!
model.pyvista_mesh().save('model3d_re3.vtk')

# with h5py.File('mesh3d.h5', 'w') as f:
#     mesh.toHdf(f, 'test')

# with h5py.File('mesh3d.h5', 'r') as f:
#     mesh2 = RectilinearMesh3D.fromHdf(f['test'])

# mesh2.pyvista_mesh().save('mesh3d_read.vtk')

plt.show()
Total running time of the script: (0 minutes 0.959 seconds)