If flowlines aren't digitized in the expected direction, this will reorder the nodes so they are.
Arguments
- id
integer The id of the flowline to check
- network
data.frame network compatible with hydroloom_names.
- fn_list
list containing named elements
flowline,network, andcheck_end, whereflowlineis the flowline to be checked andnetworkthe feature up or downstream of the flowline to be checked, andcheck_endis"start"or"end"depending if thenetworkinput is upstream ("start") or downstream ("end") of the flowline to be checked. This option allows pre-compilation of pairs of features which may be useful for very large numbers of flow direction checks.
Examples
x <- sf::read_sf(system.file("extdata/new_hope.gpkg", package = "hydroloom"))

# We add a tocomid with prepare_nhdplus
x <- add_toids(hy(x))

# Look at the end node of the 10th line.
(n1 <- get_node(x[10, ], position = "end"))
#> Simple feature collection with 1 feature and 0 fields
#> Geometry type: POINT
#> Dimension:     XY
#> Bounding box:  xmin: 1520118 ymin: 1560497 xmax: 1520118 ymax: 1560497
#> Projected CRS: +proj=aea +lat_0=23 +lon_0=-96 +lat_1=29.5 +lat_2=45.5 +x_0=0 +y_0=0 +ellps=GRS80 +towgs84=0,0,0,0,0,0,0 +units=m +no_defs
#>                  geometry
#> 1 POINT (1520118 1560497)

# Break the geometry by reversing it.
sf::st_geometry(x)[10] <- sf::st_reverse(sf::st_geometry(x)[10])

# Note that the end node is different now.
(n2 <- get_node(x[10, ], position = "end"))
#> Simple feature collection with 1 feature and 0 fields
#> Geometry type: POINT
#> Dimension:     XY
#> Bounding box:  xmin: 1520229 ymin: 1560983 xmax: 1520229 ymax: 1560983
#> Projected CRS: +proj=aea +lat_0=23 +lon_0=-96 +lat_1=29.5 +lat_2=45.5 +x_0=0 +y_0=0 +ellps=GRS80 +towgs84=0,0,0,0,0,0,0 +units=m +no_defs
#>                  geometry
#> 1 POINT (1520229 1560983)

# Pass the broken geometry to fix_flowdir with the network for toCOMID
sf::st_geometry(x)[10] <- fix_flowdir(x$id[10], x)

# Note that the geometry is now in the right order.
(n3 <- get_node(x[10, ], position = "end"))
#> Simple feature collection with 1 feature and 0 fields
#> Geometry type: POINT
#> Dimension:     XY
#> Bounding box:  xmin: 1520118 ymin: 1560497 xmax: 1520118 ymax: 1560497
#> Projected CRS: +proj=aea +lat_0=23 +lon_0=-96 +lat_1=29.5 +lat_2=45.5 +x_0=0 +y_0=0 +ellps=GRS80 +towgs84=0,0,0,0,0,0,0 +units=m +no_defs
#>                  geometry
#> 1 POINT (1520118 1560497)

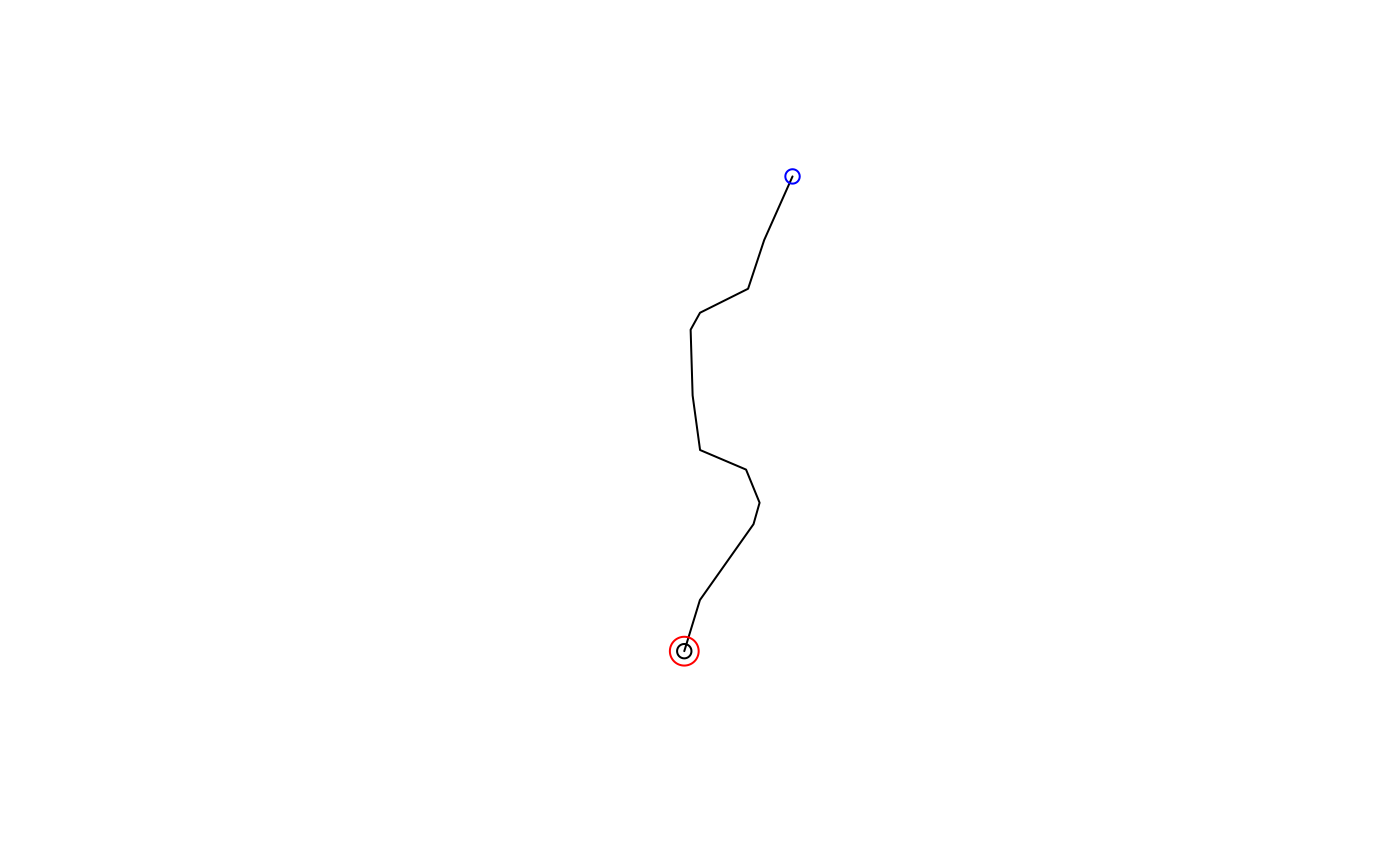
plot(sf::st_geometry(x)[10])
plot(n1, add = TRUE)
plot(n2, add = TRUE, col = "blue")
plot(n3, add = TRUE, cex = 2, col = "red")

