USGS dataretrieval Python Package get_continuous() Examples
This notebook provides examples of using the Python dataretrieval package to retrieve continuous (instantaneous, or “unit”) values data for a United States Geological Survey (USGS) monitoring location. The dataretrieval package provides a collection of functions to get data from the USGS Water Data API and other online sources of hydrology and water quality data.
Install the Package
Use the following code to install the package if it doesn’t exist already within your Jupyter Python environment.
[1]:
!pip install dataretrieval
Requirement already satisfied: dataretrieval in /opt/hostedtoolcache/Python/3.13.14/x64/lib/python3.13/site-packages (0.1.dev1+gd2920217d)
Requirement already satisfied: httpx in /opt/hostedtoolcache/Python/3.13.14/x64/lib/python3.13/site-packages (from dataretrieval) (0.28.1)
Requirement already satisfied: pandas<4.0.0,>=2.0.0 in /opt/hostedtoolcache/Python/3.13.14/x64/lib/python3.13/site-packages (from dataretrieval) (3.0.5)
Requirement already satisfied: anyio>=4.0 in /opt/hostedtoolcache/Python/3.13.14/x64/lib/python3.13/site-packages (from dataretrieval) (4.14.2)
Requirement already satisfied: numpy>=1.26.0 in /opt/hostedtoolcache/Python/3.13.14/x64/lib/python3.13/site-packages (from pandas<4.0.0,>=2.0.0->dataretrieval) (2.5.1)
Requirement already satisfied: python-dateutil>=2.8.2 in /opt/hostedtoolcache/Python/3.13.14/x64/lib/python3.13/site-packages (from pandas<4.0.0,>=2.0.0->dataretrieval) (2.9.0.post0)
Requirement already satisfied: idna>=2.8 in /opt/hostedtoolcache/Python/3.13.14/x64/lib/python3.13/site-packages (from anyio>=4.0->dataretrieval) (3.18)
Requirement already satisfied: six>=1.5 in /opt/hostedtoolcache/Python/3.13.14/x64/lib/python3.13/site-packages (from python-dateutil>=2.8.2->pandas<4.0.0,>=2.0.0->dataretrieval) (1.17.0)
Requirement already satisfied: certifi in /opt/hostedtoolcache/Python/3.13.14/x64/lib/python3.13/site-packages (from httpx->dataretrieval) (2026.7.22)
Requirement already satisfied: httpcore==1.* in /opt/hostedtoolcache/Python/3.13.14/x64/lib/python3.13/site-packages (from httpx->dataretrieval) (1.0.9)
Requirement already satisfied: h11>=0.16 in /opt/hostedtoolcache/Python/3.13.14/x64/lib/python3.13/site-packages (from httpcore==1.*->httpx->dataretrieval) (0.16.0)
Load the package so you can use it along with other packages used in this notebook.
[2]:
from datetime import date

from IPython.display import display

import dataretrieval.waterdata as waterdata
Basic Usage
The dataretrieval package has several functions that allow you to retrieve data from the USGS Water Data API. This example uses the get_continuous() function to retrieve continuous (instantaneous) streamflow data for a USGS monitoring location. The following arguments are supported:
monitoring_location_id (string or iterable of strings): One or more unique monitoring location identifiers. An ID combines the agency code with the location number, separated by a hyphen (e.g.
USGS-10109000).parameter_code (string or iterable of strings): One or more 5-digit USGS parameter codes identifying the constituent measured and its units (e.g.
00060for discharge).time (string): The date or time interval for which to retrieve observations, given as an RFC 3339 date-time, a bounded or half-bounded interval (e.g.
2021-09-01/2021-09-30), or an ISO 8601 duration. Continuous data are requested withtime, and no more than three years of data may be requested per call. Iftimeis omitted, the service returns the most recent year of measurements.
Example 1: Get unit value data for a specific parameter at a USGS monitoring location between a begin and end date
[3]:
# Set the parameters needed for the web service call
siteID = "USGS-10109000"  # LOGAN RIVER ABOVE STATE DAM, NEAR LOGAN, UT
parameterCode = "00060"  # Discharge
startDate = "2021-09-01"
endDate = "2021-09-30"

# Get the data
discharge = waterdata.get_continuous(
    monitoring_location_id=siteID, parameter_code=parameterCode, time=f"{startDate}/{endDate}"
)
print("Retrieved " + str(len(discharge[0])) + " data values.")
Retrieving: continuous · 1 page · 2,785 rows
No API key detected — register for higher rate limits at https://api.waterdata.usgs.gov/signup/
Retrieved 2785 data values.
Interpreting the Result
The get_continuous() function returns a tuple of two objects: a pandas data frame holding the observed values for the time period requested, and an associated metadata object. The data frame is flat, with a default integer index and one row per observation; the observation timestamps are stored in a tz-aware UTC time column rather than being used as the index.
Once you’ve got the data frame, there are several useful things you can do to explore the data.
[4]:
# Display the data frame as a table
display(discharge[0])
| geometry | time_series_id | monitoring_location_id | parameter_code | statistic_id | time | value | unit_of_measure | approval_status | qualifier | last_modified | continuous_id | |
|---|---|---|---|---|---|---|---|---|---|---|---|---|
| 0 | POINT (-111.78398 41.74355) | 92bf2ab5ea7d4c0080a619fbd5e360d9 | USGS-10109000 | 00060 | 00011 | 2021-09-01 00:00:00+00:00 | 55.9 | ft^3/s | Approved | None | 2025-07-03 18:26:44.437050+00:00 | c1d51022-849f-4c9c-a680-f5956bab8bc9 |
| 1 | POINT (-111.78398 41.74355) | 92bf2ab5ea7d4c0080a619fbd5e360d9 | USGS-10109000 | 00060 | 00011 | 2021-09-01 00:15:00+00:00 | 55.9 | ft^3/s | Approved | None | 2025-07-03 18:26:44.437050+00:00 | e283ab0d-0dc7-4c7c-b29a-11a990f47c5b |
| 2 | POINT (-111.78398 41.74355) | 92bf2ab5ea7d4c0080a619fbd5e360d9 | USGS-10109000 | 00060 | 00011 | 2021-09-01 00:30:00+00:00 | 55.9 | ft^3/s | Approved | None | 2025-07-03 18:26:44.437050+00:00 | 33a3d549-51e2-4b47-b420-b607fd0b3497 |
| 3 | POINT (-111.78398 41.74355) | 92bf2ab5ea7d4c0080a619fbd5e360d9 | USGS-10109000 | 00060 | 00011 | 2021-09-01 00:45:00+00:00 | 55.9 | ft^3/s | Approved | None | 2025-07-03 18:26:44.437050+00:00 | f3fb4785-5109-434e-8625-c59f5554cd18 |
| 4 | POINT (-111.78398 41.74355) | 92bf2ab5ea7d4c0080a619fbd5e360d9 | USGS-10109000 | 00060 | 00011 | 2021-09-01 01:00:00+00:00 | 55.9 | ft^3/s | Approved | None | 2025-07-03 18:26:44.437050+00:00 | c91ea645-9a58-4265-b0e0-d628dd4000ab |
| ... | ... | ... | ... | ... | ... | ... | ... | ... | ... | ... | ... | ... |
| 2780 | POINT (-111.78398 41.74355) | 92bf2ab5ea7d4c0080a619fbd5e360d9 | USGS-10109000 | 00060 | 00011 | 2021-09-29 23:00:00+00:00 | 53.2 | ft^3/s | Approved | None | 2025-07-03 18:26:44.437050+00:00 | 7c019805-71a2-4f6e-85c6-901274cb124e |
| 2781 | POINT (-111.78398 41.74355) | 92bf2ab5ea7d4c0080a619fbd5e360d9 | USGS-10109000 | 00060 | 00011 | 2021-09-29 23:15:00+00:00 | 53.2 | ft^3/s | Approved | None | 2025-07-03 18:26:44.437050+00:00 | 20f92c76-913e-40e0-b1e8-7ad590503c22 |
| 2782 | POINT (-111.78398 41.74355) | 92bf2ab5ea7d4c0080a619fbd5e360d9 | USGS-10109000 | 00060 | 00011 | 2021-09-29 23:30:00+00:00 | 53.2 | ft^3/s | Approved | None | 2025-07-03 18:26:44.437050+00:00 | 987b74ac-c2d1-44ce-aa92-06184f0cc29b |
| 2783 | POINT (-111.78398 41.74355) | 92bf2ab5ea7d4c0080a619fbd5e360d9 | USGS-10109000 | 00060 | 00011 | 2021-09-29 23:45:00+00:00 | 53.2 | ft^3/s | Approved | None | 2025-07-03 18:26:44.437050+00:00 | a5540ab1-47db-4bdc-947f-e4f5a7ba1884 |
| 2784 | POINT (-111.78398 41.74355) | 92bf2ab5ea7d4c0080a619fbd5e360d9 | USGS-10109000 | 00060 | 00011 | 2021-09-30 00:00:00+00:00 | 53.2 | ft^3/s | Approved | None | 2025-07-03 18:26:44.437050+00:00 | b3bc536e-615c-4ae2-a05a-df77b318f40a |
2785 rows × 12 columns
Show the data types of the columns in the resulting data frame.
[5]:
print(discharge[0].dtypes)
geometry                             geometry
time_series_id                            str
monitoring_location_id                    str
parameter_code                            str
statistic_id                              str
time                      datetime64[us, UTC]
value                                 float64
unit_of_measure                           str
approval_status                           str
qualifier                              object
last_modified             datetime64[us, UTC]
continuous_id                             str
dtype: object
Get summary statistics for the streamflow values.
[6]:
discharge[0].describe()
[6]:
| value | |
|---|---|
| count | 2785.000000 |
| mean | 51.565278 |
| std | 4.184643 |
| min | 24.400000 |
| 25% | 49.100000 |
| 50% | 53.200000 |
| 75% | 54.500000 |
| max | 76.400000 |
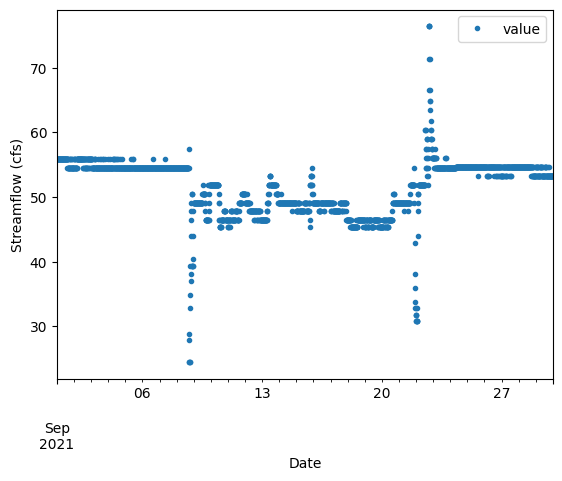
Make a quick time series plot.
[7]:
ax = discharge[0].plot(x="time", y="value", style=".")
ax.set_xlabel("Date")
ax.set_ylabel("Streamflow (cfs)")
---------------------------------------------------------------------------
TypeError                                 Traceback (most recent call last)
Cell In[7], line 1
----> 1 ax = discharge[0].plot(x="time", y="value", style=".")
      2 ax.set_xlabel("Date")
      3 ax.set_ylabel("Streamflow (cfs)")

File /opt/hostedtoolcache/Python/3.13.14/x64/lib/python3.13/site-packages/geopandas/plotting.py:962, in GeoplotAccessor.__call__(self, *args, **kwargs)
    960 kind = kwargs.pop("kind", "geo")
    961 if kind == "geo":
--> 962     return plot_dataframe(data, *args, **kwargs)
    963 if kind in self._pandas_kinds:
    964     # Access pandas plots
    965     return PlotAccessor(data)(kind=kind, **kwargs)

File /opt/hostedtoolcache/Python/3.13.14/x64/lib/python3.13/site-packages/geopandas/plotting.py:688, in plot_dataframe(df, column, cmap, color, ax, cax, categorical, legend, scheme, k, vmin, vmax, markersize, figsize, legend_kwds, categories, classification_kwds, missing_kwds, aspect, autolim, **style_kwds)
    685     markersize = df[markersize].values
    687 if column is None:
--> 688     return plot_series(
    689         df.geometry,
    690         cmap=cmap,
    691         color=color,
    692         ax=ax,
    693         figsize=figsize,
    694         markersize=markersize,
    695         aspect=aspect,
    696         autolim=autolim,
    697         **style_kwds,
    698     )
    700 # To accept pd.Series and np.arrays as column
    701 if isinstance(column, np.ndarray | pd.Series | pd.Index):

File /opt/hostedtoolcache/Python/3.13.14/x64/lib/python3.13/site-packages/geopandas/plotting.py:476, in plot_series(s, cmap, color, ax, figsize, aspect, autolim, **style_kwds)
    473     values_ = values[point_idx] if cmap else None
    474     color_ = expl_color[point_idx] if color_given else color
--> 476     _plot_point_collection(
    477         ax, points, values_, color=color_, cmap=cmap, **style_kwds
    478     )
    480 ax.figure.canvas.draw_idle()
    481 return ax

File /opt/hostedtoolcache/Python/3.13.14/x64/lib/python3.13/site-packages/geopandas/plotting.py:305, in _plot_point_collection(ax, geoms, values, color, cmap, vmin, vmax, marker, markersize, **kwargs)
    302 _expand_kwargs(kwargs, multiindex)
    304 if "norm" not in kwargs:
--> 305     collection = ax.scatter(x, y, vmin=vmin, vmax=vmax, cmap=cmap, **kwargs)
    306 else:
    307     collection = ax.scatter(x, y, cmap=cmap, **kwargs)

    [... skipping hidden 1 frame]

File /opt/hostedtoolcache/Python/3.13.14/x64/lib/python3.13/site-packages/matplotlib/__init__.py:1528, in _preprocess_data.<locals>.inner(ax, data, *args, **kwargs)
   1525 __tracebackhide__ = True
   1527 if data is None:
-> 1528     return func(
   1529         ax,
   1530         *map(cbook.sanitize_sequence, args),
   1531         **{k: cbook.sanitize_sequence(v) for k, v in kwargs.items()})
   1533 bound = new_sig.bind(ax, *args, **kwargs)
   1534 auto_label = (bound.arguments.get(label_namer)
   1535               or bound.kwargs.get(label_namer))

TypeError: Axes.scatter() got multiple values for argument 'x'
The other part of the result returned from the get_continuous() function is a metadata object that contains information about the query that was executed to return the data. For example, you can access the URL that was assembled to retrieve the requested data from the USGS Water Data API.
[8]:
print("The query URL used to retrieve the data from the Water Data API was: " + discharge[1].url)
The query URL used to retrieve the data from the Water Data API was: https://api.waterdata.usgs.gov/ogcapi/v0/collections/continuous/items?monitoring_location_id=USGS-10109000¶meter_code=00060&time=2021-09-01%2F2021-09-30&limit=50000
Additional Examples
Example 2: Get unit values for an individual monitoring location and parameter between a start and end date.
NOTE: By default, the start and end dates are interpreted in the monitoring location’s local time. Regardless of the input time zone, the returned time column is tz-aware UTC (see Example 4 for supplying UTC input explicitly).
[9]:
site_id = "USGS-05114000"
startDate = "2014-10-10"
endDate = "2014-10-10"

discharge2 = waterdata.get_continuous(
    monitoring_location_id=site_id, parameter_code=parameterCode, time=f"{startDate}/{endDate}"
)
print("Retrieved " + str(len(discharge2[0])) + " data values.")
display(discharge2[0])
Retrieving: continuous · 1 page · 1 rows
Retrieved 1 data values.
| geometry | time_series_id | monitoring_location_id | parameter_code | statistic_id | time | value | unit_of_measure | approval_status | qualifier | last_modified | continuous_id | |
|---|---|---|---|---|---|---|---|---|---|---|---|---|
| 0 | POINT (-101.95778 48.99) | 987c2d767a5a4981acffd51fa253b63b | USGS-05114000 | 00060 | 00011 | 2014-10-10 00:00:00+00:00 | 481 | ft^3/s | Approved | None | 2025-09-01 12:22:04.139884+00:00 | bde6e74b-0d6c-4f13-bbc8-8ed1ff336fc6 |
Example 3: Get unit values for an individual monitoring location for today
[10]:
today = str(date.today())
discharge_today = waterdata.get_continuous(
    monitoring_location_id=site_id, parameter_code=parameterCode, time=f"{today}/{today}"
)
print("Retrieved " + str(len(discharge_today[0])) + " data values.")
display(discharge_today[0])
Retrieving: continuous · 1 page · 1 rows
Retrieved 1 data values.
| geometry | time_series_id | monitoring_location_id | parameter_code | statistic_id | time | value | unit_of_measure | approval_status | qualifier | last_modified | continuous_id | |
|---|---|---|---|---|---|---|---|---|---|---|---|---|
| 0 | POINT (-101.95778 48.99) | 987c2d767a5a4981acffd51fa253b63b | USGS-05114000 | 00060 | 00011 | 2026-07-23 00:00:00+00:00 | 75.3 | ft^3/s | Provisional | None | 2026-07-23 00:16:16.398458+00:00 | fca86879-7844-4153-b2ad-955d6c23f6c9 |
Example 4: Retrieve data using UTC times
NOTE: Adding ‘Z’ to the input time parameters indicates that they are in UTC rather than local time. The returned timestamps are tz-aware UTC in either case.
[11]:
discharge_UTC = waterdata.get_continuous(
    monitoring_location_id=site_id,
    parameter_code=parameterCode,
    time="2014-10-10T00:00Z/2014-10-10T23:59Z",
)
print("Retrieved " + str(len(discharge_UTC[0])) + " data values.")
display(discharge_UTC[0])
Retrieving: continuous · 1 page · 96 rows
Retrieved 96 data values.
| geometry | time_series_id | monitoring_location_id | parameter_code | statistic_id | time | value | unit_of_measure | approval_status | qualifier | last_modified | continuous_id | |
|---|---|---|---|---|---|---|---|---|---|---|---|---|
| 0 | POINT (-101.95778 48.99) | 987c2d767a5a4981acffd51fa253b63b | USGS-05114000 | 00060 | 00011 | 2014-10-10 00:00:00+00:00 | 481 | ft^3/s | Approved | None | 2025-09-01 12:22:04.139884+00:00 | bde6e74b-0d6c-4f13-bbc8-8ed1ff336fc6 |
| 1 | POINT (-101.95778 48.99) | 987c2d767a5a4981acffd51fa253b63b | USGS-05114000 | 00060 | 00011 | 2014-10-10 00:15:00+00:00 | 481 | ft^3/s | Approved | None | 2025-09-01 12:22:04.139884+00:00 | ac396e6b-d731-419a-9f7f-807b5e3cec73 |
| 2 | POINT (-101.95778 48.99) | 987c2d767a5a4981acffd51fa253b63b | USGS-05114000 | 00060 | 00011 | 2014-10-10 00:30:00+00:00 | 480 | ft^3/s | Approved | None | 2025-09-01 12:22:04.139884+00:00 | 889af5a8-850c-46e0-afb3-e472991a7001 |
| 3 | POINT (-101.95778 48.99) | 987c2d767a5a4981acffd51fa253b63b | USGS-05114000 | 00060 | 00011 | 2014-10-10 00:45:00+00:00 | 480 | ft^3/s | Approved | None | 2025-09-01 12:22:04.139884+00:00 | ac1198c8-0857-43e1-998b-f1e7382429eb |
| 4 | POINT (-101.95778 48.99) | 987c2d767a5a4981acffd51fa253b63b | USGS-05114000 | 00060 | 00011 | 2014-10-10 01:00:00+00:00 | 480 | ft^3/s | Approved | None | 2025-09-01 12:22:04.139884+00:00 | e787d026-fce2-4f1f-a253-d2e0af849e06 |
| ... | ... | ... | ... | ... | ... | ... | ... | ... | ... | ... | ... | ... |
| 91 | POINT (-101.95778 48.99) | 987c2d767a5a4981acffd51fa253b63b | USGS-05114000 | 00060 | 00011 | 2014-10-10 22:45:00+00:00 | 478 | ft^3/s | Approved | None | 2025-09-01 12:22:04.139884+00:00 | 0922c174-5d17-4751-88a6-63455b407486 |
| 92 | POINT (-101.95778 48.99) | 987c2d767a5a4981acffd51fa253b63b | USGS-05114000 | 00060 | 00011 | 2014-10-10 23:00:00+00:00 | 478 | ft^3/s | Approved | None | 2025-09-01 12:22:04.139884+00:00 | 2470636f-3b9d-4cda-968b-dabd01b1a844 |
| 93 | POINT (-101.95778 48.99) | 987c2d767a5a4981acffd51fa253b63b | USGS-05114000 | 00060 | 00011 | 2014-10-10 23:15:00+00:00 | 478 | ft^3/s | Approved | None | 2025-09-01 12:22:04.139884+00:00 | f6b7c7c7-058b-4264-95a1-3683c095d92e |
| 94 | POINT (-101.95778 48.99) | 987c2d767a5a4981acffd51fa253b63b | USGS-05114000 | 00060 | 00011 | 2014-10-10 23:30:00+00:00 | 478 | ft^3/s | Approved | None | 2025-09-01 12:22:04.139884+00:00 | c293157c-bd5b-4685-bb06-4a7597ca2932 |
| 95 | POINT (-101.95778 48.99) | 987c2d767a5a4981acffd51fa253b63b | USGS-05114000 | 00060 | 00011 | 2014-10-10 23:45:00+00:00 | 478 | ft^3/s | Approved | None | 2025-09-01 12:22:04.139884+00:00 | 7bc54eb8-654d-4294-b22e-6ebd2ecf5c1f |
96 rows × 12 columns
Example 5: Get unit values for two monitoring locations, for a single parameter, between a start and end date
[12]:
discharge_multisite = waterdata.get_continuous(
    monitoring_location_id=["USGS-04024430", "USGS-04024000"],
    parameter_code=parameterCode,
    time="2013-10-01/2013-10-01",
)
print("Retrieved " + str(len(discharge_multisite[0])) + " data values.")
display(discharge_multisite[0])
Retrieving: continuous · 1 page · 2 rows
Retrieved 2 data values.
| geometry | time_series_id | monitoring_location_id | parameter_code | statistic_id | time | value | unit_of_measure | approval_status | qualifier | last_modified | continuous_id | |
|---|---|---|---|---|---|---|---|---|---|---|---|---|
| 0 | POINT (-92.41838 46.70351) | 38100b0bedd043a8b2c8dfb7cde830d3 | USGS-04024000 | 00060 | 00011 | 2013-10-01 00:00:00+00:00 | 567.0 | ft^3/s | Approved | None | 2025-08-27 16:02:26.026729+00:00 | 86d87afb-0c3c-4e64-b759-4a1e7ae3d374 |
| 1 | POINT (-92.09389 46.63333) | 24dfcb980fb24aa1b44e129b67b11a73 | USGS-04024430 | 00060 | 00011 | 2013-10-01 00:00:00+00:00 | 63.0 | ft^3/s | Approved | None | 2025-08-21 19:19:27.898360+00:00 | 50e6a614-b358-4b01-83e0-8c7ac21a8730 |