Calculations Quick-Reference
A quick-reference guide to the common types of calculations performed within the hyswap package is provided below. See the Glossary section for definitions of specific terms. Also, refer to the API Reference section for more detailed documentation on specific functions within hyswap.
Assumptions and Caveats
The hyswap package functions assume that provided streamflow data are quality controlled. No checks on incorrect, missing, or negative values are performed. Users should perform any necessary QA/QC checks on the data prior to using hyswap functions. Additionally, hyswap does not detect artifacts or shifts in streamflow data that potentially violate statistical methods, such as:
negative flows associated with tidal-influenced locations or other phenomena
regulated flows or transitions from regulated to unregulated flows (or vice versa)
major watershed changes
Streamflow Percentiles
Streamflow percentiles are a core calculation of hyswap that are used to determine streamflow conditions (e.g., normal, high-flow, low-flow, drought, flood). Percentiles can be computed from daily streamflow (discharge), n-day average streamflow, or runoff. Multiple types of percentiles are used in hydrologic analysis and vary in what subset of observations are used in calculating a given set of percentiles. Percentiles are closely related to exceedance probabilities used to construct flow duration curves (see below). The hyswap package provides support for the following types of streamflow percentiles:
Percentile Type |
Description |
|---|---|
Variable (Day of Year) |
Computed using flow observations for that day from all years of record resulting in percentile classes/thresholds that change seasonally and correspond to a specific day of year. Variable percentiles are useful for characterizing flow conditions relative to the typical flow on a given day of the year. The variable (day of year) percentile is the standard percentile that is displayed in USGS water data services. |
Fixed (All days) |
Computed using all flow observations in the period of record. Records from all days of the year are combined resulting in percentile classes/thresholds that do not change seasonally. Fixed percentiles are useful for characterizing flow conditions relative to non-moving phenomena such as flood stages or dam intakes. |
Variable Moving Window (Day of Year) |
Computed using flow observations for that day plus or minus n number of days (e.g., 7, 14, or 30) from all years of record resulting in percentile classes/thresholds that change seasonally and correspond to a specific day of year. Variable moving window percentiles reduce the fluctuation in percentile classes from day-to-day, especially for sites with short observation records. Variable moving window is useful for characterizing flow conditions relative to typical flow expected on a given day of the year. |
By default, hyswap computes streamflow percentiles using the unbiased Weibull plotting position expression, \(i/(n+1)\), where i is the rank of an observation and n is the sample size (Weibull, 1939). The Weibull formula has been the standard approach used by hydrologists for generating flow-duration and flood-frequency curves (Helsel and others, 2020). Weibull plotting position does not set values to either 0 or 100, recognizing the existence of a non-zero probablity of exceeding the maximum or minimum observed value. For further discussion of plotting positions refer to (Helsel and others, 2020).
hyswap uses the numpy.percentile() implementation of the Weibull method (Type 6) for calculating percentiles. Additional methods of computing percentiles that exist in the numpy.percentile() function can be used in hyswap. Users can refer to the numpy function documentation for additional details.
Other default settings for percentile calculations are that NA values are dropped and percentile levels of 5, 10, 25, 50, 75, 90, and 95 are calculated. Additionally, percentile levels that are beyond the min/max percentile ranks of the observed data are by default set to NA; the effect of this being that high or low percentiles (e.g., 1, 99) will not be able to be calculated when few data points are available.
hyswap uses the numpy.percentile() implementation of the Weibull method (Type 6) for calculating percentiles
Exceedance Probabilities and Flow-Duration Curves
In some hydrological studies, particularly those related to floods, a variation of the percentile known as the “percent exceedance” is used. It can be obtained by subtracting the percentile scale value from 100 percent. For example, a discharge at the 75th percentile is the same as a discharge at the 25th percent exceedance (100-75=25). By default, hyswap computes streamflow exceedance probabilities using the unbiased Weibull plotting position formula (Weibull, 1939). Additional methods of computing exceedance probabilities can be used in hyswap including linear (R Type 4), Hazen (R Type 5), Gumbel (R Type 7), Reiss (R Type 8), and Blom (R Type 9). Flow-duration curves computed within hyswap are cumulative frequency curves where values indicate either (1) the percent of values equal to or less than each discharge value (percentile) OR (2) the percent of values equal to or greater than each discharge value (percent exceedance). The Weibull method of computing exceedance probabilities is used by default for computing flow-duration curves.
Flow Categorization
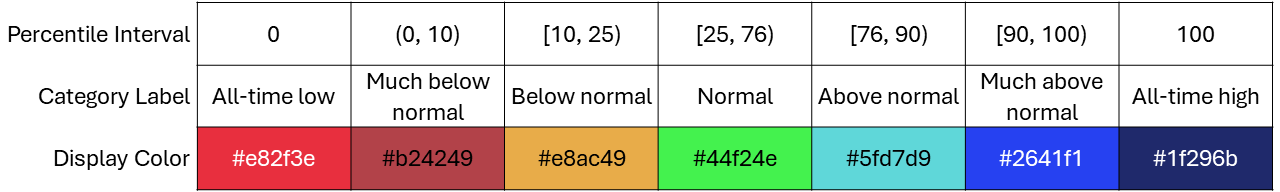
Streamflow observations at a streamgage can be assigned a flow condition category using hyswap by use of the hyswap hyswap.utils.categorize_flows function. Streamflow percentiles or interpolated estimated streamflow percentiles are compared to a categorization schema. Multiple categorization schema are available in hyswap with the default being flow categories similar to those displayed on the USGS National Water Dashboard. Categorization schema are applicable to both variable and fixed percentile types. Available schema are described below:
- “NWD” – Categorization schema similar to the USGS National Water Dashboard, default
Categorizes streamflow across all range of possible streamflow magnitudes. Typically used with variable percentiles
- “WaterWatch” – Categorization schema similar to the USGS WaterWatch website
Categorizes streamflow across all range of possible streamflow magnitudes. Typically used with variable percentiles

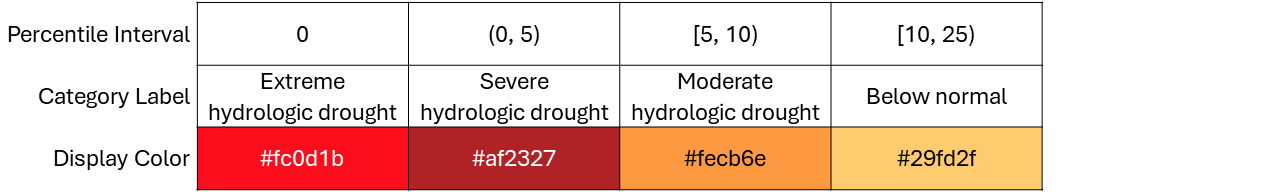
- “NIDIS_Drought” – Categorization schema similar to the NIDIS U.S. Drought Monitor
Categorizes streamflow across only low-flow conditions.

- “WaterWatch_Drought” – Categorization schema similar to the USGS WaterWatch Drought Conditions
Categorizes streamflow across only low-flow conditions. Typically used with variable percentiles
- “WaterWatch_Flood” – Categorization schema similar to the USGS WaterWatch Flood Conditions
Categorizes streamflow across only high-flow conditions. Typically used with fixed percentiles

- “WaterWatch_BrownBlue” – Categorization schema similar to the USGS WaterWatch categories but with an alternative color palette
Categorizes streamflow across all range of possible streamflow magnitudes. Typically used with variable percentiles

Area-Based Runoff
In addition to information on a per-streamgage basis, hyswap can generate water information at the regional scale through computation of area-based runoff calculations. Estimates of runoff for a given region or drainage basin (e.g., state or HUC2 region) are generated by combining streamflow data collected at USGS streamgages at the sub-basin scale using a weighted average approach.
The calculation of area-based runoff in hyswap involves the steps described below and illustrated in an example in Figure 1:
Compute runoff values (flow per unit area) for each streamgage basin by dividing the average daily flow by the delineated drainage area. Drainage areas are an input to the
streamflow_to_runofffunction inhyswapto obtain runoff in units of millimeters per unit time (e.g. day, month, year).Calculate runoff for each hydrologic unit (in this example below, each HUC8) that is in the area of interest (e.g., state or HUC2 region) using the runoff from multiple streamgages along with associated overlap between streamgage basins and the hydrologic unit. This process is discussed in detail under the ‘Workflow for Estimating Area-Based Runoff’ section. The dataframe containing the proportion of hydrologic unit in each streamgage basin and the proportion of streamgage basin area in each hydrologic unit is an input to the
calculate_geometric_runofffunctions inhyswapfunctions. This intersection table must be created from spatial data layers describing hydrologic unit and streamgage basin boundaries (more info below).Aggregate runoff from the individual hydrologic units that are within the area of interest (e.g., state or HUC2 region).
Workflow for Associating Streamgages with Hydrologic Units (HUC8s) for Area-Based Runoff Calculations
Spatial datasets describing the respective drainage basin boundaries of the streamgages and the boundaries of hydrologic units must be obtained that cover all areas of interest (e.g. CONUS). Geospatial boundaries of streamgages may be based on delineated gage drainage areas calculated using NHDPlus Version 1 data (U.S. Geological Survey, 2011) or determined via other watershed delineation approaches. Hydrologic unit boundaries are contained within the USGS Watershed Boundary Dataset (WBD).
Each geospatial streamgage drainage basin boundary is overlain on a geospatial dataset of hydrologic units (the polygons outlined in thick gray-brown lines in Figure 1 example) to determine the area of intersection within the two datasets. For each overlapping area of hydrologic units and streamgage drainage basin boundaries, the fraction of the basin in the hydrologic unit and the fraction of the hydrologic unit in the basin are calculated. These fractions are then multiplied by each other to compute a weighting factor for each basin in the runoff calculation.
You can find an example intersection dataset between CONUS hydrologic units and streamgage basins in the hyswap-example-notebooks repository. This intersection dataset was created using the hyswap water geospatial data assembly repository.
Workflow for Estimating Area-Based Runoff
After obtaining a table of intersecting hydrologic units and streamgage basins, the next step of the analysis is to determine which streamgage basins should be used to calculate a weighted average of runoff values for each hydrologic unit over each unit of time (e.g. days, months, years). The weight for each streamgage basin-hydrologic unit intersection is the product of the proportion of the hydrologic unit’s area in the streamgage basin area and the proportion of the streamgage basin’s area in the hydrologic unit area. hyswap offers two options for estimating runoff using streamgage basins that overlap the hydrologic units:
For each unit of time with runoff data at one or more streamgages whose basins intersect the hydrologic unit, obtain a weighted average of all runoff values.
If a hydrologic unit and a streamgage basin have near perfect overlap (e.g. the proportion of the hydrologic unit’s area in the basin is greater than 0.9 and the proportion of the basin’s area in the hydrologic unit is greater than 0.9), simply use the runoff values from that streamgage basin. If perfect overlap does not exist, use a weighted average of runoff values from:
all streamgage basins contained by the hydrologic unit, and
the smallest streamgage basin that contains the hydrologic unit
Note that in cases where there is near perfect overlap for multiple streamgage basins and a hydrologic unit, the streamgage basin-hydrologic unit intersection with the highest weight is used to estimate runoff. This is the same method used to determine the smallest streamgage basin that contains the hydrologic unit: among all the streamgage basins that contain the hydrologic unit (in other words, the proportion of the hydrologic unit’s area in the streamgage basins is roughly 1), find the hydrologic unit-streamgage basin intersection with the highest weight (which means the proportion of the streamgage basin’s area in the hydrologic unit is the largest). See Figure 1 for an example of this workflow. Note that in Figure 1, ‘Fraction#’ is analogous to ‘proportion of shape X’s area in shape Y’.
An example Jupyter notebook exemplifying this workflow is available for download from the hyswap repository and can be viewed within the hyswap documentation.

Figure 1. Example computation for computation of runoff for a selected HUC unit. (The drainage area of basin A is shaded light gray and the drainage area of basin B is shaded pink. Note that drainage basin B is nested within drainage basin A). Figure from (Brakebill and others, 2011) In this figure, ‘Fraction#’ is analogous to ‘proportion of shape X’s area in shape Y’.
Note: Description of methods for area-based runoff computation is adapted from USGS WaterWatch.
Streamflow Record Similarity
Identifying streamgages that are most similar or correlated is a common task when identifying potential streamgages to be used for estimating missing records or other hydrological modeling tasks. hyswap can compute the similarity of streamflow records using different similarity measures and plot these as a matrix. The available measures are:
Similarity Measure |
Description |
|---|---|
Pearson’s r correlation |
Commonly used measure of correlation that measures the linear association between two datasets (Helsel and others, 2020). Calculation of Pearson’s r correlation on daily streamflow records or log-transformed daily streamflow records is often used to identify potential index or reference streamgages (Yuan, 2013). |
Wasserstein Distance |
A metric that measures the distance between two distributions and in a hydrological context measures the “effort” required to rearrange one distribution of water into the other. The Wasserstein distance can be used to compare how similar two hydrographs are to each other (Magyar & Sambridge, 2023). |
Energy Distance |
A metric that measures the distance between two distributions. The energy is experimental in hydrology but has been used to identify similarity between time series such electricity demand (Ziel, 2021). |
References
Brakebill, J.W., D.M. Wolock, and S.E. Terziotti, 2011. Digital Hydrologic Networks Supporting Applications Related to Spatially Referenced Regression Modeling. Journal of the American Water Resources Association (JAWRA) 47(5):916-932.
Helsel, D.R., Hirsch, R.M., Ryberg, K.R., Archfield, S.A., and Gilroy, E.J., 2020. Statistical methods in water resources: U.S. Geological Survey Techniques and Methods, book 4, chap. A3, 458 p., https://doi.org/10.3133/tm4a3. [Supersedes USGS Techniques of Water-Resources Investigations, book 4, chap. A3, version 1.1.]
Magyar, J.C. & Sambridge, M., 2023. Hydrological objective functions and ensemble averaging with the Wasserstein distance, Hydrol. Earth Syst. Sci., 27, 991–1010, https://doi.org/10.5194/hess-27-991-2023.
U.S. Geological Survey, 2011. USGS Streamgage NHDPlus Version 1 Basins 2011. Data Series [DS-719] sciencebase.gov/catalog/item/631405ccd34e36012efa32dc
U.S. Geological Survey, 2023. USGS water data for the Nation: U.S. Geological Survey National Water Information System database, accessed at https://waterdata.usgs.gov/.
Weibull, W., 1939. A statistical theory of strength of materials, Ingeniors Vetenskaps Akademien Handlinga, no. 153, 9. 17
Yuan, L.L., 2013. Using correlation of daily flows to identify index gauges for ungauged streams, Water Resour. Res., 49, https://doi.org/10.1002/wrcr.20070.
Ziel, F., 2021. The energy distance for ensemble and scenario reduction, Phil, Trans. R. Soc. A. 379: 20190431, https://doi.org/10.1098/rsta.2019.0431.