05: Unstructured grid and general mesh generation with FloPy
In this notebook we’ll cover how to build Structured and Unstructured Meshes (Grids) with FloPy for use in MODFLOW models.
This notebook will start with generating a simple Structured Grid and we will use this grid object to begin developing Unstructured Meshes. The grids generated in theis notebook include the following:
Regular structured grid (review)
Irregular structured grid with variable row and column spacings
Local Grid Refinement (LGR): A locally refined mesh that can be subsetted into a second model within a MODFLOW simulation
Quadtree Mesh: A mesh with a four fold (quad) refinement for each grid cell in a given refinement area
Triangular Mesh: A triangular mesh generated using Delaunay triangulation
Voronoi Mesh: A mesh generated from the connected centers of the Delaunay triangulation circumcircles
[1]:
import warnings
from pathlib import Path

import flopy
import geopandas as gpd
import matplotlib.pyplot as plt
import numpy as np
import pandas as pd
import contextily as ctx
from dataretrieval import nldi, nwis
from flopy.discretization import StructuredGrid, VertexGrid
from flopy.plot import PlotMapView
from flopy.utils.gridgen import Gridgen
from flopy.utils.gridintersect import GridIntersect
from flopy.utils.lgrutil import Lgr
from flopy.utils.rasters import Raster
from flopy.utils.triangle import Triangle
from flopy.utils.voronoi import VoronoiGrid
from shapely.errors import ShapelyDeprecationWarning

warnings.simplefilter("ignore", DeprecationWarning)
warnings.simplefilter("ignore", ShapelyDeprecationWarning)
---------------------------------------------------------------------------
ModuleNotFoundError                       Traceback (most recent call last)
Cell In[1], line 9
      5 import geopandas as gpd
      6 import matplotlib.pyplot as plt
      7 import numpy as np
      8 import pandas as pd
----> 9 import contextily as ctx
     10 from dataretrieval import nldi, nwis
     11 from flopy.discretization import StructuredGrid, VertexGrid
     12 from flopy.plot import PlotMapView

ModuleNotFoundError: No module named 'contextily'
Creating a regular structured (rectilinear) grid
This activity will start by creating a simple sturctured (rectilinear) grid from a 1/3 arc second Digital Elevation Model of the Sagehen Creek watershed as an illustration of how we can create an initial mesh that can be used to develop a model from.
This is a quick review for more information, see the previous activity 04_Modelgrid_and_intersection.ipynb
Load the Digital Elevation Model and visualize it
[2]:
data_ws = Path("./data")
geospatial_ws = data_ws / "unstructured_grid_data"
dem = geospatial_ws / "dem.img"
rstr = Raster.load(dem)
rstr.plot();
---------------------------------------------------------------------------
NameError                                 Traceback (most recent call last)
Cell In[2], line 4
      1 data_ws = Path("./data")
      2 geospatial_ws = data_ws / "unstructured_grid_data"
      3 dem = geospatial_ws / "dem.img"
----> 4 rstr = Raster.load(dem)
      5 rstr.plot();

NameError: name 'Raster' is not defined
Get the DEM boundaries
[3]:
xmin, xmax, ymin, ymax = rstr.bounds
epsg = rstr.crs.to_epsg()
print(f"{xmin=}, {xmax=}")
print(f"{epsg=}")
---------------------------------------------------------------------------
NameError                                 Traceback (most recent call last)
Cell In[3], line 1
----> 1 xmin, xmax, ymin, ymax = rstr.bounds
      2 epsg = rstr.crs.to_epsg()
      3 print(f"{xmin=}, {xmax=}")
      4 print(f"{epsg=}")

NameError: name 'rstr' is not defined
And begin developing an initial mesh for the model
[4]:
# live code modelgrid creation
cellsize = 200
Finally create a fake top, bottom, and idomain for the model for now. These will be refined in a subsequent step.
[5]:
# live code modelgrid creation
And now we can generate a StructuredGrid object (called sgrid) that can be used for developing model inputs
[6]:
# live code modelgrid creation
We can plot our SturcturedGrid object over the existing raster data to check that it is correctly orientied in space
[7]:
fig, ax = plt.subplots(figsize=(6, 6))
rstr.plot(ax=ax)
pmv = PlotMapView(modelgrid=sgrid, ax=ax)
pmv.plot_grid(lw=0.5);
---------------------------------------------------------------------------
NameError                                 Traceback (most recent call last)
Cell In[7], line 2
      1 fig, ax = plt.subplots(figsize=(6, 6))
----> 2 rstr.plot(ax=ax)
      3 pmv = PlotMapView(modelgrid=sgrid, ax=ax)
      4 pmv.plot_grid(lw=0.5);

NameError: name 'rstr' is not defined
Resampling data to finish creating our initial grid.
Once we have an initial grid, raster and vector data can be resampled or intersected with the grid to begin building a model domain. Although the focus of this notebook is to generate different types of meshes for modeling, the resampling and intersection process in this notebook can be applied many different data types and be used to generate boundary conditions within a MODFLOW model.
Raster resampling
We’ll use FloPy’s built in raster resampling method to generate values for land surface elevation (top) using the existing StructuredGrid object. For more information on raster resampling, please see this example
[8]:
top = rstr.resample_to_grid(
    sgrid, rstr.bands[0], method="min", extrapolate_edges=True
)
---------------------------------------------------------------------------
NameError                                 Traceback (most recent call last)
Cell In[8], line 1
----> 1 top = rstr.resample_to_grid(
      2     sgrid, rstr.bands[0], method="min", extrapolate_edges=True
      3 )

NameError: name 'rstr' is not defined
[9]:
fig, ax = plt.subplots(figsize=(7, 7))
pmv = PlotMapView(modelgrid=sgrid)
pc = pmv.plot_array(top)
pmv.plot_grid(lw=0.5)
plt.colorbar(pc, shrink=0.7);
---------------------------------------------------------------------------
NameError                                 Traceback (most recent call last)
Cell In[9], line 2
      1 fig, ax = plt.subplots(figsize=(7, 7))
----> 2 pmv = PlotMapView(modelgrid=sgrid)
      3 pc = pmv.plot_array(top)
      4 pmv.plot_grid(lw=0.5)
      5 plt.colorbar(pc, shrink=0.7);

NameError: name 'PlotMapView' is not defined
Vector (shapefile) intersection review
We can also intersect lines, points, and polygons with an existing modelgrid object. In this example, we’ll load up the watershed boundary and get the active and inactive areas of the grid. For more information on intersecting shapefiles with a modelgrid/model see this example
Our first step in this process is to get the watershed boundary. We can use the dataretrieval package to begin downloading information about the watershed from NWIS.
Note: this information has been stored in the repository as shapefiles if internet access is not available.
[10]:
# the get_info() call accepts a decimal lat/lon bounding box
griddf = sgrid.geo_dataframe.set_crs(epsg=26911)
grid_wgs = griddf.to_crs(epsg=4326)

wxmin, wxmax, wymin, wymax = grid_wgs.total_bounds
wgs_bounds = [wxmin, wymin, wxmax, wymax]

try:
    info, metadata = nwis.get_info(bBox=[f"{i :.2f}" for i in wgs_bounds])
except (ValueError, ConnectionError, NameError):
    info = gpd.read_file(geospatial_ws / "gage_info.shp")

info.head()
---------------------------------------------------------------------------
NameError                                 Traceback (most recent call last)
Cell In[10], line 2
      1 # the get_info() call accepts a decimal lat/lon bounding box
----> 2 griddf = sgrid.geo_dataframe.set_crs(epsg=26911)
      3 grid_wgs = griddf.to_crs(epsg=4326)
      4
      5 wxmin, wxmax, wymin, wymax = grid_wgs.total_bounds

NameError: name 'sgrid' is not defined
Reproject the gage data into UTM Zone 11 N
[11]:
info = info.to_crs(epsg=epsg)
---------------------------------------------------------------------------
NameError                                 Traceback (most recent call last)
Cell In[11], line 1
----> 1 info = info.to_crs(epsg=epsg)

NameError: name 'info' is not defined
And plot the gage data on the raster
[12]:
fig, ax = plt.subplots()

rstr.plot(ax=ax)
info.plot(
    column="site_no",
    ax=ax,
    cmap="tab20",
    legend=True,
    legend_kwds={"fontsize": 6},
);
---------------------------------------------------------------------------
NameError                                 Traceback (most recent call last)
Cell In[12], line 3
      1 fig, ax = plt.subplots()
      2
----> 3 rstr.plot(ax=ax)
      4 info.plot(
      5     column="site_no",
      6     ax=ax,

NameError: name 'rstr' is not defined

Grab the site record for gage number 10343500
[13]:
sitedf = info.loc[info.site_no == "10343500"]
sitedf
---------------------------------------------------------------------------
NameError                                 Traceback (most recent call last)
Cell In[13], line 1
----> 1 sitedf = info.loc[info.site_no == "10343500"]
      2 sitedf

NameError: name 'info' is not defined
Get the upstream basin from nldi using the NWIS stream gage station code
[14]:
try:
    basindf = nldi.get_basin(
        feature_source="nwissite",
        feature_id=f"USGS-{sitedf.site_no.values[0]}",
    )
    basindf = basindf.to_crs(epsg=epsg)
except (ValueError, ConnectionError, NameError):
    basindf = gpd.read_file(geospatial_ws / "basin_boundary.shp")
---------------------------------------------------------------------------
DataSourceError                           Traceback (most recent call last)
Cell In[14], line 8
      4         feature_id=f"USGS-{sitedf.site_no.values[0]}",
      5     )
      6     basindf = basindf.to_crs(epsg=epsg)
      7 except (ValueError, ConnectionError, NameError):
----> 8     basindf = gpd.read_file(geospatial_ws / "basin_boundary.shp")

File ~/micromamba/envs/pyclass-docs/lib/python3.14/site-packages/geopandas/io/file.py:316, in _read_file(filename, bbox, mask, columns, rows, engine, **kwargs)
    313             filename = response.read()
    315 if engine == "pyogrio":
--> 316     return _read_file_pyogrio(
    317         filename, bbox=bbox, mask=mask, columns=columns, rows=rows, **kwargs
    318     )
    320 elif engine == "fiona":
    321     if pd.api.types.is_file_like(filename):

File ~/micromamba/envs/pyclass-docs/lib/python3.14/site-packages/geopandas/io/file.py:576, in _read_file_pyogrio(path_or_bytes, bbox, mask, rows, **kwargs)
    567     warnings.warn(
    568         "The 'include_fields' and 'ignore_fields' keywords are deprecated, and "
    569         "will be removed in a future release. You can use the 'columns' keyword "
   (...)    572         stacklevel=3,
    573     )
    574     kwargs["columns"] = kwargs.pop("include_fields")
--> 576 return pyogrio.read_dataframe(path_or_bytes, bbox=bbox, **kwargs)

File ~/micromamba/envs/pyclass-docs/lib/python3.14/site-packages/pyogrio/geopandas.py:382, in read_dataframe(path_or_buffer, layer, encoding, columns, read_geometry, force_2d, skip_features, max_features, where, bbox, mask, fids, sql, sql_dialect, fid_as_index, use_arrow, on_invalid, arrow_to_pandas_kwargs, datetime_as_string, mixed_offsets_as_utc, **kwargs)
    374 gdal_force_2d = False if use_arrow else force_2d
    376 # Always read datetimes as string values to preserve (mixed) time zone info
    377 # correctly. If arrow is not used, it is needed because numpy does not
    378 # directly support time zones + performance is also a lot better. If arrow
    379 # is used, needed because datetime columns don't support mixed time zone
    380 # offsets + e.g. for .fgb files time zone info isn't handled correctly even
    381 # for unique time zone offsets if datetimes are not read as string.
--> 382 result = read_func(
    383     path_or_buffer,
    384     layer=layer,
    385     encoding=encoding,
    386     columns=columns,
    387     read_geometry=read_geometry,
    388     force_2d=gdal_force_2d,
    389     skip_features=skip_features,
    390     max_features=max_features,
    391     where=where,
    392     bbox=bbox,
    393     mask=mask,
    394     fids=fids,
    395     sql=sql,
    396     sql_dialect=sql_dialect,
    397     return_fids=fid_as_index,
    398     datetime_as_string=True,
    399     **kwargs,
    400 )
    402 if use_arrow:
    403     import pyarrow as pa

File ~/micromamba/envs/pyclass-docs/lib/python3.14/site-packages/pyogrio/raw.py:200, in read(path_or_buffer, layer, encoding, columns, read_geometry, force_2d, skip_features, max_features, where, bbox, mask, fids, sql, sql_dialect, return_fids, datetime_as_string, **kwargs)
     59 """Read OGR data source into numpy arrays.
     60
     61 IMPORTANT: non-linear geometry types (e.g., MultiSurface) are converted
   (...)    196
    197 """
    198 dataset_kwargs = _preprocess_options_key_value(kwargs) if kwargs else {}
--> 200 return ogr_read(
    201     get_vsi_path_or_buffer(path_or_buffer),
    202     layer=layer,
    203     encoding=encoding,
    204     columns=columns,
    205     read_geometry=read_geometry,
    206     force_2d=force_2d,
    207     skip_features=skip_features,
    208     max_features=max_features or 0,
    209     where=where,
    210     bbox=bbox,
    211     mask=_mask_to_wkb(mask),
    212     fids=fids,
    213     sql=sql,
    214     sql_dialect=sql_dialect,
    215     return_fids=return_fids,
    216     dataset_kwargs=dataset_kwargs,
    217     datetime_as_string=datetime_as_string,
    218 )

File pyogrio/_io.pyx:1412, in pyogrio._io.ogr_read()
-> 1412 'Could not get source, probably due dynamically evaluated source code.'

File pyogrio/_io.pyx:262, in pyogrio._io.ogr_open()
--> 262 'Could not get source, probably due dynamically evaluated source code.'

DataSourceError: data/unstructured_grid_data/basin_boundary.shp: No such file or directory
Plot up the basin boundary with the existing raster
[15]:
fig, ax = plt.subplots()
rstr.plot(ax=ax)
basindf.plot(ax=ax, facecolor="None", edgecolor="k", lw=1.5)
info.plot(
    column="site_no",
    ax=ax,
    cmap="tab20",
    legend=True,
    legend_kwds={"fontsize": 6},
);
---------------------------------------------------------------------------
NameError                                 Traceback (most recent call last)
Cell In[15], line 2
      1 fig, ax = plt.subplots()
----> 2 rstr.plot(ax=ax)
      3 basindf.plot(ax=ax, facecolor="None", edgecolor="k", lw=1.5)
      4 info.plot(
      5     column="site_no",

NameError: name 'rstr' is not defined
Doing the intersection
[16]:
ix = GridIntersect(sgrid)
result = ix.intersect(basindf.geometry.values[0], contains_centroid=True)
rowcol = result["cellids"]
---------------------------------------------------------------------------
NameError                                 Traceback (most recent call last)
Cell In[16], line 1
----> 1 ix = GridIntersect(sgrid)
      2 result = ix.intersect(basindf.geometry.values[0], contains_centroid=True)
      3 rowcol = result["cellids"]

NameError: name 'GridIntersect' is not defined
[17]:
row, col = list(zip(*rowcol))
---------------------------------------------------------------------------
NameError                                 Traceback (most recent call last)
Cell In[17], line 1
----> 1 row, col = list(zip(*rowcol))

NameError: name 'rowcol' is not defined
Building idomain from the intersection
[18]:
idomain = np.zeros((nlay, nrow, ncol), dtype=int)
idomain[:, row, col] = 1
---------------------------------------------------------------------------
NameError                                 Traceback (most recent call last)
Cell In[18], line 1
----> 1 idomain = np.zeros((nlay, nrow, ncol), dtype=int)
      2 idomain[:, row, col] = 1

NameError: name 'nlay' is not defined
Putting it all together into a completed StructuredGrid
[19]:
sgrid = StructuredGrid(
    delc=sgrid.delc,
    delr=sgrid.delr,
    top=top,
    botm=sgrid.botm,
    idomain=idomain,
    nlay=sgrid.nlay,
    nrow=sgrid.nrow,
    ncol=sgrid.ncol,
    xoff=sgrid.xoffset,
    yoff=sgrid.yoffset,
    crs=sgrid.crs,
)
sgrid
---------------------------------------------------------------------------
NameError                                 Traceback (most recent call last)
Cell In[19], line 1
----> 1 sgrid = StructuredGrid(
      2     delc=sgrid.delc,
      3     delr=sgrid.delr,
      4     top=top,

NameError: name 'StructuredGrid' is not defined
Plotting the completed grid with gage locations and the watershed boundary
[20]:
fig, ax = plt.subplots(figsize=(5, 5))
pmv = PlotMapView(modelgrid=sgrid)
pc = pmv.plot_array(sgrid.top)
ib = pmv.plot_inactive()
pmv.plot_grid(lw=0.5)
plt.colorbar(pc, shrink=0.7)

basindf.plot(ax=ax, facecolor="None", edgecolor="r", lw=1.5)
sitedf.plot(
    column="site_no",
    ax=ax,
    cmap="tab20",
    legend=True,
    legend_kwds={"fontsize": 6},
    zorder=6
);
---------------------------------------------------------------------------
NameError                                 Traceback (most recent call last)
Cell In[20], line 2
      1 fig, ax = plt.subplots(figsize=(5, 5))
----> 2 pmv = PlotMapView(modelgrid=sgrid)
      3 pc = pmv.plot_array(sgrid.top)
      4 ib = pmv.plot_inactive()
      5 pmv.plot_grid(lw=0.5)

NameError: name 'PlotMapView' is not defined

Because this is a watershed, we can also overlay a shapefile of the streams and get the stream cells using GridIntersect
NHD-Plus stream lines can be downloaded using streamgage information with the dataretrieval package
[21]:
try:
    nhddf = nldi.get_flowlines(
        navigation_mode="UT",
        distance=999,
        feature_source="nwissite",
        feature_id=f"USGS-{sitedf.site_no.values[0]}",
    )
    nhddf = nhddf.to_crs(epsg=epsg)
except (ValueError, ConnectionError, NameError):
    nhddf = gpd.read_file(geospatial_ws / "nhd_streams.shp")

nhddf.head()
[21]:
| nhdplus_co | geometry | |
|---|---|---|
| 0 | 8933522 | LINESTRING (221038.59 4369598.73, 221076.943 4... |
| 1 | 8933608 | LINESTRING (220451.353 4367186.202, 220542.627... |
| 2 | 8933524 | LINESTRING (220541.209 4369697.393, 220691.816... |
| 3 | 8934342 | LINESTRING (219823.023 4371753.116, 219905.68 ... |
| 4 | 8933520 | LINESTRING (220240.836 4369758.678, 220245.466... |
Intersect stream lines with the existing modelgrid
[22]:
rowcols = []
ix = GridIntersect(sgrid)
for geom in nhddf.geometry.values:
    rcs = ix.intersects(geom)["cellids"]
    rowcols.extend(list(rcs))
---------------------------------------------------------------------------
NameError                                 Traceback (most recent call last)
Cell In[22], line 2
      1 rowcols = []
----> 2 ix = GridIntersect(sgrid)
      3 for geom in nhddf.geometry.values:
      4     rcs = ix.intersects(geom)["cellids"]
      5     rowcols.extend(list(rcs))

NameError: name 'GridIntersect' is not defined
[23]:
row, col = list(zip(*rowcols))
strms = np.zeros((nrow, ncol))
strms[row, col] = 1
strms
---------------------------------------------------------------------------
ValueError                                Traceback (most recent call last)
Cell In[23], line 1
----> 1 row, col = list(zip(*rowcols))
      2 strms = np.zeros((nrow, ncol))
      3 strms[row, col] = 1
      4 strms

ValueError: not enough values to unpack (expected 2, got 0)
Plot the intersection results
[24]:
fig, ax = plt.subplots(figsize=(5, 5))
pmv = PlotMapView(modelgrid=sgrid, ax=ax)
pc = pmv.plot_array(sgrid.top, cmap="viridis")
pmv.plot_array(strms, masked_values=[0,], alpha=0.3, cmap="Reds_r")
pmv.plot_inactive()
pmv.plot_grid(lw=0.5)
plt.colorbar(pc, shrink=0.7)
nhddf.plot(ax=ax);
---------------------------------------------------------------------------
NameError                                 Traceback (most recent call last)
Cell In[24], line 2
      1 fig, ax = plt.subplots(figsize=(5, 5))
----> 2 pmv = PlotMapView(modelgrid=sgrid, ax=ax)
      3 pc = pmv.plot_array(sgrid.top, cmap="viridis")
      4 pmv.plot_array(strms, masked_values=[0,], alpha=0.3, cmap="Reds_r")
      5 pmv.plot_inactive()

NameError: name 'PlotMapView' is not defined
Information from the grid we’ve created here can now be used for generating more complex meshes.
Irregular structured Grid (DIS)
In this example, an irregular structured grid is created to demonstrate how to add local refinement to an area of the model using a structured (rectilinear) grid.
[25]:
lx = xmax - xmin
ly = ymax - ymin
cellsize = 200
rcellsize = 100

smooth = np.linspace(100, 200, 10).tolist()
delr = 9 * [cellsize] + smooth[::-1] + 8 * [rcellsize] + smooth + 9 * [cellsize]
delc = 8 * [cellsize] + smooth[::-1] + 7 * [rcellsize] + smooth + 8 * [cellsize]
nlay = 1
nrow = len(delc)
ncol = len(delr)

# create some fake data for the moment
top = np.ones((nrow, ncol))
botm = np.zeros((nlay, nrow, ncol))
idomain = np.ones(botm.shape, dtype=int)
---------------------------------------------------------------------------
NameError                                 Traceback (most recent call last)
Cell In[25], line 1
----> 1 lx = xmax - xmin
      2 ly = ymax - ymin
      3 cellsize = 200
      4 rcellsize = 100

NameError: name 'xmax' is not defined
[26]:
rfgrid = StructuredGrid(
    delc=np.array(delc),
    delr=np.array(delr),
    nlay=nlay,
    top=top,
    botm=botm,
    idomain=idomain,
    xoff=xmin,
    yoff=ymin
)
print(nlay, nrow, ncol)
print(rfgrid.nrow, rfgrid.ncol)
---------------------------------------------------------------------------
NameError                                 Traceback (most recent call last)
Cell In[26], line 1
----> 1 rfgrid = StructuredGrid(
      2     delc=np.array(delc),
      3     delr=np.array(delr),
      4     nlay=nlay,

NameError: name 'StructuredGrid' is not defined
Intersect the basin boundary with the grid to set active and inactive cells (idomain)
[27]:
ix = GridIntersect(rfgrid)
result = ix.intersect(basindf.geometry.values[0], contains_centroid=True)
rowcol = result["cellids"]

row, col = list(zip(*rowcol))
idomain = np.zeros((nlay, nrow, ncol), dtype=int)
idomain[:, row, col] = 1

# tricky way so we don't have to recreate the grid
rfgrid._idomain = idomain
---------------------------------------------------------------------------
NameError                                 Traceback (most recent call last)
Cell In[27], line 1
----> 1 ix = GridIntersect(rfgrid)
      2 result = ix.intersect(basindf.geometry.values[0], contains_centroid=True)
      3 rowcol = result["cellids"]
      4

NameError: name 'GridIntersect' is not defined
Resample the top elevation
[28]:
top = rstr.resample_to_grid(
    rfgrid, rstr.bands[0], method="min", extrapolate_edges=True
)

# tricky way so we don't have to recreate the grid
rfgrid._top = top
---------------------------------------------------------------------------
NameError                                 Traceback (most recent call last)
Cell In[28], line 1
----> 1 top = rstr.resample_to_grid(
      2     rfgrid, rstr.bands[0], method="min", extrapolate_edges=True
      3 )
      4

NameError: name 'rstr' is not defined
Now we can plot the grid
[29]:
fig, ax = plt.subplots(figsize=(5, 5))
pmv = PlotMapView(modelgrid=rfgrid)
pc = pmv.plot_array(rfgrid.top, cmap="viridis")
ib = pmv.plot_inactive()
pmv.plot_grid(lw=0.5)
plt.colorbar(pc, shrink=0.7)

basindf.plot(ax=ax, facecolor="None", edgecolor="r", lw=1.5)
sitedf.plot(
    column="site_no",
    ax=ax,
    cmap="tab20",
    legend=True,
    legend_kwds={"fontsize": 6},
    zorder=6
);
---------------------------------------------------------------------------
NameError                                 Traceback (most recent call last)
Cell In[29], line 2
      1 fig, ax = plt.subplots(figsize=(5, 5))
----> 2 pmv = PlotMapView(modelgrid=rfgrid)
      3 pc = pmv.plot_array(rfgrid.top, cmap="viridis")
      4 ib = pmv.plot_inactive()
      5 pmv.plot_grid(lw=0.5)

NameError: name 'PlotMapView' is not defined

Local Grid Refinement (LGR) mesh
A Local Grid Refinement (LGR) mesh can be created in an area of interest to get finer discretization than the existing/surrounding mesh. FloPy’s Lgr utility, creates the refined mesh as a seperate modelgrid, and calculates the exchanges between the multi-model simulation mesh that results from refinement.
The Lgr utility has a number of input parameters:
nlayp: the number of parent model layersnrowp: the number of parent model rowsncolp: the number of parent model columnsdelrp: the parent model delr arraydelcp: the parent model delc arraytopp: the parent model top arraybotmp: the parent model botm arrayidomainp: an idomain array that is used to create the child grid. Values of 1 indicate parent model cells, values of 0 indicate child model cells. The child model must be a rectangular region that is continuous.ncpp: number of child cells along the face of a parent cellncppl: number of child cells per parent layerxllp: (optional) x location of parent grid lower left corneryllp: (optional) y-location of parent grid lower left corner
Load up the refinement area polygon
[30]:
lgr_gdf = gpd.read_file(geospatial_ws / "lgr_bound.shp")
Plot it to see if it lines up properly with our model
[31]:
fig, ax = plt.subplots(figsize=(5, 5))
pmv = PlotMapView(modelgrid=sgrid, ax=ax)
pc = pmv.plot_array(sgrid.top, cmap="viridis")
pmv.plot_array(strms, masked_values=[0,], alpha=0.3, cmap="Reds_r")
pmv.plot_inactive()
pmv.plot_grid(lw=0.5)
nhddf.plot(ax=ax)
lgr_gdf.plot(ax=ax, alpha=0.5)
plt.colorbar(pc, shrink=0.7);
---------------------------------------------------------------------------
NameError                                 Traceback (most recent call last)
Cell In[31], line 2
      1 fig, ax = plt.subplots(figsize=(5, 5))
----> 2 pmv = PlotMapView(modelgrid=sgrid, ax=ax)
      3 pc = pmv.plot_array(sgrid.top, cmap="viridis")
      4 pmv.plot_array(strms, masked_values=[0,], alpha=0.3, cmap="Reds_r")
      5 pmv.plot_inactive()

NameError: name 'PlotMapView' is not defined

Creating the parent/child idomainp array for Lgr using GridIntersect
[32]:
lgr_gdf
[32]:
| Id | geometry | |
|---|---|---|
| 0 | 0 | POLYGON ((221180.716 4369310.065, 219973.134 4... |
Activity: Create the idomainp (parent, child) array from the polygon provided by the lgr geodataframe
idomainp should be the same shape as the existing modelgrid’s idomain array. The child model extent should be represented with the value 0 and the parent 1.
Hint: GridIntersect() can be used to find the cellids where the lgr polygon intersects with the existing modelgrid
[33]:
# live code this/give it as an activity
idomainp = np.ones(sgrid.idomain.shape, dtype=int)

gix = GridIntersect(sgrid)
result = gix.intersect(lgr_gdf.geometry.values[0])
cid = result["cellids"]

crow, ccol = list(zip(*cid))
idomainp[:, crow, ccol] = 0
---------------------------------------------------------------------------
NameError                                 Traceback (most recent call last)
Cell In[33], line 2
      1 # live code this/give it as an activity
----> 2 idomainp = np.ones(sgrid.idomain.shape, dtype=int)
      3
      4 gix = GridIntersect(sgrid)
      5 result = gix.intersect(lgr_gdf.geometry.values[0])

NameError: name 'sgrid' is not defined
Creating the Lgr object/child grid
[34]:
lgr = Lgr(
    nlayp=sgrid.nlay,
    nrowp=sgrid.nrow,
    ncolp=sgrid.ncol,
    delrp=sgrid.delr,
    delcp=sgrid.delc,
    topp=sgrid.top,
    botmp=sgrid.botm,
    idomainp=idomainp,
    ncpp=4,
    xllp=sgrid.xoffset,
    yllp=sgrid.yoffset,
)
---------------------------------------------------------------------------
NameError                                 Traceback (most recent call last)
Cell In[34], line 1
----> 1 lgr = Lgr(
      2     nlayp=sgrid.nlay,
      3     nrowp=sgrid.nrow,
      4     ncolp=sgrid.ncol,

NameError: name 'Lgr' is not defined
Get a StructuredGrid of the child model
[35]:
childgrid = lgr.child.modelgrid
childgrid
---------------------------------------------------------------------------
NameError                                 Traceback (most recent call last)
Cell In[35], line 1
----> 1 childgrid = lgr.child.modelgrid
      2 childgrid

NameError: name 'lgr' is not defined
Resample top elevations to the child grid
[36]:
childtop = rstr.resample_to_grid(childgrid, band=rstr.bands[0], method="min")
print(childtop.shape)
print(childgrid.shape)
---------------------------------------------------------------------------
NameError                                 Traceback (most recent call last)
Cell In[36], line 1
----> 1 childtop = rstr.resample_to_grid(childgrid, band=rstr.bands[0], method="min")
      2 print(childtop.shape)
      3 print(childgrid.shape)

NameError: name 'rstr' is not defined
Reset the top elevations in the childgrid object
[37]:
childgrid._top = childtop
---------------------------------------------------------------------------
NameError                                 Traceback (most recent call last)
Cell In[37], line 1
----> 1 childgrid._top = childtop

NameError: name 'childtop' is not defined
Intersect streams with the Child mesh to define stream cells
[38]:
ix = GridIntersect(childgrid)
cstrmcells = []
for geom in nhddf.geometry.values:
    rcs = ix.intersects(geom)["cellids"]
    if len(rowcol) > 0:
        cstrmcells.extend(list(rcs))

cstrms = np.zeros((childgrid.nrow, childgrid.ncol), dtype=int)
row, col = list(zip(*cstrmcells))
cstrms[row, col] = 1
---------------------------------------------------------------------------
NameError                                 Traceback (most recent call last)
Cell In[38], line 1
----> 1 ix = GridIntersect(childgrid)
      2 cstrmcells = []
      3 for geom in nhddf.geometry.values:
      4     rcs = ix.intersects(geom)["cellids"]

NameError: name 'GridIntersect' is not defined
And now we can visualize the new LGR mesh
[39]:
fig, ax = plt.subplots(figsize=(10, 10))
vmin, vmax = np.min(sgrid.top), np.max(sgrid.top)

# plot the parent
pmvp = PlotMapView(modelgrid=sgrid, ax=ax)
ptop = sgrid.top.copy()
ptop[crow, ccol] = np.nan
strms[crow, ccol] = np.nan
pc = pmvp.plot_array(ptop, cmap="viridis", vmin=vmin, vmax=vmax)
pmvp.plot_array(strms, masked_values=[0,], alpha=0.3, cmap="Reds_r")
pmvp.plot_inactive()
pmvp.plot_grid(lw=0.3)
nhddf.plot(ax=ax)

# plot the child
pmvc = PlotMapView(modelgrid=childgrid, ax=ax, extent=sgrid.extent)
pmvc.plot_array(childtop, cmap="viridis", vmin=vmin, vmax=vmax)
pmvc.plot_array(cstrms, masked_values=[0,], alpha=0.3, cmap="Reds_r")
pmvc.plot_grid(lw=0.3)
plt.colorbar(pc, shrink=0.7);
---------------------------------------------------------------------------
NameError                                 Traceback (most recent call last)
Cell In[39], line 2
      1 fig, ax = plt.subplots(figsize=(10, 10))
----> 2 vmin, vmax = np.min(sgrid.top), np.max(sgrid.top)
      3
      4 # plot the parent
      5 pmvp = PlotMapView(modelgrid=sgrid, ax=ax)

NameError: name 'sgrid' is not defined
Quadtree Mesh
A quadtree mesh is an unstructured refinement to a rectilinear modelgrid. In a quadtree mesh each node is split into 4 child nodes per level of refinement. The figure below is from Lien and others, 2019 and shows multiple levels of recursive refinement.

For this example, we will be using GRIDGEN and the FloPy utility Gridgen to create quadtree refinement around the streams in our example.
[40]:
gridgen_dir = data_ws / "sagehen_gridgen"
gridgen_dir.mkdir(exist_ok=True)
The Gridgen class a number of input parameters and further documentation/examples of the class can be found here. For our example, we will be refining the area around the stream channels.
[41]:
g = Gridgen(sgrid, model_ws=gridgen_dir)
for geom in nhddf.geometry.values:
    xy = list(zip(*geom.coords.xy))
    g.add_refinement_features([xy,], "line", 2, [0,])
---------------------------------------------------------------------------
NameError                                 Traceback (most recent call last)
Cell In[41], line 1
----> 1 g = Gridgen(sgrid, model_ws=gridgen_dir)
      2 for geom in nhddf.geometry.values:
      3     xy = list(zip(*geom.coords.xy))
      4     g.add_refinement_features([xy,], "line", 2, [0,])

NameError: name 'Gridgen' is not defined
[42]:
g.build()
---------------------------------------------------------------------------
NameError                                 Traceback (most recent call last)
Cell In[42], line 1
----> 1 g.build()

NameError: name 'g' is not defined
After gridgen builds the mesh, it can be used to create a VertexGrid (or DISV) that represents the basin
[43]:
gridprops = g.get_gridprops_disv()
gridprops.pop("nvert")

quadgrid = VertexGrid(**gridprops)
quadgrid.extent
---------------------------------------------------------------------------
NameError                                 Traceback (most recent call last)
Cell In[43], line 1
----> 1 gridprops = g.get_gridprops_disv()
      2 gridprops.pop("nvert")
      3
      4 quadgrid = VertexGrid(**gridprops)

NameError: name 'g' is not defined
Resample top elevations to the quadtree mesh and intersect the basin boundary and stream vectors
[44]:
# create the top array
top = rstr.resample_to_grid(quadgrid, band=rstr.bands[0], method="min")
quadgrid._top = top
---------------------------------------------------------------------------
NameError                                 Traceback (most recent call last)
Cell In[44], line 2
      1 # create the top array
----> 2 top = rstr.resample_to_grid(quadgrid, band=rstr.bands[0], method="min")
      3 quadgrid._top = top

NameError: name 'rstr' is not defined
[45]:
# create the idomain array
idomain = np.zeros(quadgrid.shape, dtype=int)
ix = GridIntersect(quadgrid)
nodes = ix.intersect(basindf.geometry.values[0], contains_centroid=True)["cellids"]

idomain[:, list(nodes)] = 1
quadgrid._idomain = idomain
---------------------------------------------------------------------------
NameError                                 Traceback (most recent call last)
Cell In[45], line 2
      1 # create the idomain array
----> 2 idomain = np.zeros(quadgrid.shape, dtype=int)
      3 ix = GridIntersect(quadgrid)
      4 nodes = ix.intersect(basindf.geometry.values[0], contains_centroid=True)["cellids"]
      5

NameError: name 'quadgrid' is not defined
[46]:
# create an array of stream cells
qstr = []
ix = GridIntersect(quadgrid)
for geom in nhddf.geometry.values:
    nodes = ix.intersects(geom)["cellids"]
    qstr.extend(list(nodes))
---------------------------------------------------------------------------
NameError                                 Traceback (most recent call last)
Cell In[46], line 3
      1 # create an array of stream cells
      2 qstr = []
----> 3 ix = GridIntersect(quadgrid)
      4 for geom in nhddf.geometry.values:
      5     nodes = ix.intersects(geom)["cellids"]
      6     qstr.extend(list(nodes))

NameError: name 'GridIntersect' is not defined
[47]:
qstrms = np.zeros((quadgrid.ncpl,), dtype=int)
qstrms[qstr] = 1
---------------------------------------------------------------------------
NameError                                 Traceback (most recent call last)
Cell In[47], line 1
----> 1 qstrms = np.zeros((quadgrid.ncpl,), dtype=int)
      2 qstrms[qstr] = 1

NameError: name 'quadgrid' is not defined
Plot the quadtree mesh with top elevations and streams
[48]:
fig, ax = plt.subplots(figsize=(5, 5))

pmv = PlotMapView(modelgrid=quadgrid)
pc = pmv.plot_array(quadgrid.top)
pmv.plot_array(qstrms, masked_values=[0,], alpha=0.3, cmap="Reds_r")
pmv.plot_inactive()
pmv.plot_grid(lw=0.3)
nhddf.plot(ax=ax)
plt.colorbar(pc, shrink=0.7);
---------------------------------------------------------------------------
NameError                                 Traceback (most recent call last)
Cell In[48], line 3
      1 fig, ax = plt.subplots(figsize=(5, 5))
      2
----> 3 pmv = PlotMapView(modelgrid=quadgrid)
      4 pc = pmv.plot_array(quadgrid.top)
      5 pmv.plot_array(qstrms, masked_values=[0,], alpha=0.3, cmap="Reds_r")
      6 pmv.plot_inactive()

NameError: name 'PlotMapView' is not defined

Triangular Mesh
An unstructured/vertex based triangular mesh can be generated using the code “triangle”(Shewchuk, 2002). And the FloPy utility, Triangle that creates inputs for and translates the outputs from “triangle”.
For this example, we will be using triangle to generate a mesh and add refinement around the streams.
[49]:
tri_dir = data_ws / "sagehen_tri"
tri_dir.mkdir(exist_ok=True)
For this example, we will use the watershed boundary we downloaded from NLDI and create a dissovled polygon of stream segments to generate our triangulation regions.
[50]:
basindf.head()
---------------------------------------------------------------------------
NameError                                 Traceback (most recent call last)
Cell In[50], line 1
----> 1 basindf.head()

NameError: name 'basindf' is not defined
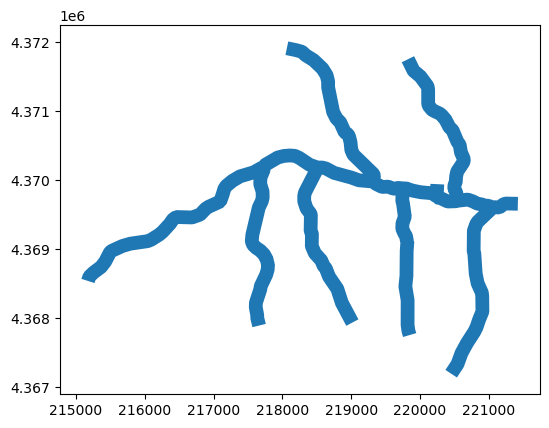
We will also dissolve and buffer the stream network into a single polygon that defines our area of refinement
[51]:
bufgdf = nhddf.dissolve()
bufgdf["geometry"] = bufgdf.geometry.buffer(100, cap_style=2, join_style=3)
bufgdf.plot();
These two polygons can now be used to generate a triangular mesh with the Triangle utility. The Triangle class has a number of input parameters. For more detail on the inputs and additional examples please see this notebook
[52]:
# define point locations within the watershed and the stream for adding regions
wsloc = (220000, 4368000)
stloc = (219250, 4370000)
[53]:
tri = Triangle(angle=30, model_ws=tri_dir)

# define the model/mesh boundary
tri.add_polygon(basindf.geometry.values[0])
tri.add_region(wsloc, 0, maximum_area=100 * 300)

# define the stream refinement area
tri.add_polygon(bufgdf.geometry.values[0])
tri.add_region(stloc, 1, maximum_area=40 * 40)
---------------------------------------------------------------------------
NameError                                 Traceback (most recent call last)
Cell In[53], line 1
----> 1 tri = Triangle(angle=30, model_ws=tri_dir)
      2
      3 # define the model/mesh boundary
      4 tri.add_polygon(basindf.geometry.values[0])

NameError: name 'Triangle' is not defined
[54]:
tri.build()
---------------------------------------------------------------------------
NameError                                 Traceback (most recent call last)
Cell In[54], line 1
----> 1 tri.build()

NameError: name 'tri' is not defined
Visualize the triangular mesh
[55]:
fig, ax = plt.subplots(figsize=(6, 6))
tri.plot(ax=ax)
nhddf.plot(ax=ax);
---------------------------------------------------------------------------
NameError                                 Traceback (most recent call last)
Cell In[55], line 2
      1 fig, ax = plt.subplots(figsize=(6, 6))
----> 2 tri.plot(ax=ax)
      3 nhddf.plot(ax=ax);

NameError: name 'tri' is not defined

Create a VertexGrid from the triangular mesh and resample the land surface elevations
[56]:
cell2d = tri.get_cell2d()
vertices = tri.get_vertices()
ncpl = len(cell2d)
nlay = 1
idomain = np.ones((nlay, ncpl), dtype=int)

# set fake values for top and botm for now)
top = np.ones((ncpl,))
botm = np.zeros((nlay, ncpl))
---------------------------------------------------------------------------
NameError                                 Traceback (most recent call last)
Cell In[56], line 1
----> 1 cell2d = tri.get_cell2d()
      2 vertices = tri.get_vertices()
      3 ncpl = len(cell2d)
      4 nlay = 1

NameError: name 'tri' is not defined
[57]:
trigrid = VertexGrid(
    vertices=vertices,
    cell2d=cell2d,
    ncpl=ncpl,
    nlay=nlay,
    idomain=idomain,
    top=top,
    botm=botm,
    crs="EPSG:26911",
)
trigrid.extent
---------------------------------------------------------------------------
NameError                                 Traceback (most recent call last)
Cell In[57], line 1
----> 1 trigrid = VertexGrid(
      2     vertices=vertices,
      3     cell2d=cell2d,
      4     ncpl=ncpl,

NameError: name 'VertexGrid' is not defined
[58]:
top = rstr.resample_to_grid(
    trigrid, band=rstr.bands[0], method="min", extrapolate_edges=True
)
trigrid._top = top
---------------------------------------------------------------------------
NameError                                 Traceback (most recent call last)
Cell In[58], line 1
----> 1 top = rstr.resample_to_grid(
      2     trigrid, band=rstr.bands[0], method="min", extrapolate_edges=True
      3 )
      4 trigrid._top = top

NameError: name 'rstr' is not defined
And perform intersection to identify stream cells
[59]:
tristr = []
ix = GridIntersect(trigrid)
for geom in nhddf.geometry.values:
    nodes = ix.intersects(geom)["cellids"]
    tristr.extend(list(nodes))

tristrms = np.zeros((trigrid.ncpl,), dtype=int)
tristrms[tristr] = 1
---------------------------------------------------------------------------
NameError                                 Traceback (most recent call last)
Cell In[59], line 2
      1 tristr = []
----> 2 ix = GridIntersect(trigrid)
      3 for geom in nhddf.geometry.values:
      4     nodes = ix.intersects(geom)["cellids"]
      5     tristr.extend(list(nodes))

NameError: name 'GridIntersect' is not defined
Now to plot up the triangular grid
[60]:
fig, ax = plt.subplots(figsize=(7, 7))

pmv = PlotMapView(modelgrid=trigrid)
pc = pmv.plot_array(trigrid.top)
pmv.plot_array(tristrms, masked_values=[0,], alpha=0.3, cmap="Reds_r")
pmv.plot_inactive()
pmv.plot_grid(lw=0.3)
nhddf.plot(ax=ax)
plt.colorbar(pc, shrink=0.7);
---------------------------------------------------------------------------
NameError                                 Traceback (most recent call last)
Cell In[60], line 3
      1 fig, ax = plt.subplots(figsize=(7, 7))
      2
----> 3 pmv = PlotMapView(modelgrid=trigrid)
      4 pc = pmv.plot_array(trigrid.top)
      5 pmv.plot_array(tristrms, masked_values=[0,], alpha=0.3, cmap="Reds_r")
      6 pmv.plot_inactive()

NameError: name 'PlotMapView' is not defined

Voronoi Mesh
A voronoi mesh can be generated from the circumcirle centroids of each triangular node in a Delaunay triangulation. The centroid of each circumcirle produces a vertex for the voronoi mesh and these vertices are connected via adjacency relationships of the triangulation.
FloPy has a built in utility VoronoiGrid that produces voronoi meshes from Delaunay triangulations. For more information and additional examples on VoronoiGrid’s usage, see this notebook
To generate a voronoi mesh, we just need to pass our triangluation object (tri) to the VoronoiGrid utility
[61]:
vor = VoronoiGrid(tri)
---------------------------------------------------------------------------
NameError                                 Traceback (most recent call last)
Cell In[61], line 1
----> 1 vor = VoronoiGrid(tri)

NameError: name 'VoronoiGrid' is not defined
Build a VertexGrid
[62]:
gridprops = vor.get_gridprops_vertexgrid()
nlay = 1
idomain = np.ones(gridprops["ncpl"], dtype=int)
top = idomain.copy().astype(float)
botm = np.zeros((nlay, gridprops["ncpl"]))
---------------------------------------------------------------------------
NameError                                 Traceback (most recent call last)
Cell In[62], line 1
----> 1 gridprops = vor.get_gridprops_vertexgrid()
      2 nlay = 1
      3 idomain = np.ones(gridprops["ncpl"], dtype=int)
      4 top = idomain.copy().astype(float)

NameError: name 'vor' is not defined
[63]:
vorgrid = VertexGrid(
    nlay=nlay, idomain=idomain, top=top, botm=botm, **gridprops
)
---------------------------------------------------------------------------
NameError                                 Traceback (most recent call last)
Cell In[63], line 1
----> 1 vorgrid = VertexGrid(
      2     nlay=nlay, idomain=idomain, top=top, botm=botm, **gridprops
      3 )

NameError: name 'VertexGrid' is not defined
Resample the land surface elevation from the DEM to the voronoi grid
[64]:
top = rstr.resample_to_grid(
    vorgrid, band=rstr.bands[0], method="min", extrapolate_edges=True
)
vorgrid._top = top
---------------------------------------------------------------------------
NameError                                 Traceback (most recent call last)
Cell In[64], line 1
----> 1 top = rstr.resample_to_grid(
      2     vorgrid, band=rstr.bands[0], method="min", extrapolate_edges=True
      3 )
      4 vorgrid._top = top

NameError: name 'rstr' is not defined
Identify stream cells with GridIntersect
[65]:
vorst = []
ix = GridIntersect(vorgrid)
for geom in nhddf.geometry.values:
    nodes = ix.intersects(geom)["cellids"]
    vorst.extend(list(nodes))

vorstrms = np.zeros((vorgrid.ncpl,), dtype=int)
vorstrms[vorst] = 1
---------------------------------------------------------------------------
NameError                                 Traceback (most recent call last)
Cell In[65], line 2
      1 vorst = []
----> 2 ix = GridIntersect(vorgrid)
      3 for geom in nhddf.geometry.values:
      4     nodes = ix.intersects(geom)["cellids"]
      5     vorst.extend(list(nodes))

NameError: name 'GridIntersect' is not defined
Finally plot the voronoi mesh with the DEM data and stream locations
[66]:
fig, ax = plt.subplots(figsize=(7, 7))

pmv = PlotMapView(modelgrid=vorgrid)
pc = pmv.plot_array(vorgrid.top)
pmv.plot_array(vorstrms, masked_values=[0], alpha=0.3, cmap="Reds_r")
pmv.plot_inactive()
pmv.plot_grid(lw=0.3)
nhddf.plot(ax=ax)
plt.colorbar(pc, shrink=0.7);
---------------------------------------------------------------------------
NameError                                 Traceback (most recent call last)
Cell In[66], line 3
      1 fig, ax = plt.subplots(figsize=(7, 7))
      2
----> 3 pmv = PlotMapView(modelgrid=vorgrid)
      4 pc = pmv.plot_array(vorgrid.top)
      5 pmv.plot_array(vorstrms, masked_values=[0], alpha=0.3, cmap="Reds_r")
      6 pmv.plot_inactive()

NameError: name 'PlotMapView' is not defined

plot the meshes we produced side by side for comparison!
[67]:
from flopy.plot import styles
from matplotlib.gridspec import GridSpec

with styles.USGSMap():
    fig, axm = plt.subplots(nrows=3, ncols=2, figsize=(10,12))
    axs = axm.ravel()

    # structured grid
    pmv = PlotMapView(modelgrid=sgrid, ax=axs[0])
    pmv.plot_array(sgrid.top, cmap="viridis")
    pmv.plot_array(strms, masked_values=[0,], alpha=0.3, cmap="Reds_r")
    pmv.plot_inactive()
    pmv.plot_grid(lw=0.3)
    nhddf.plot(ax=axs[0])
    styles.heading(axs[0], "A. ", heading="Structured Grid", x=0.08)

    # non-uniform DIS
    pmv = PlotMapView(modelgrid=rfgrid, ax=axs[1])
    pmv.plot_array(rfgrid.top, cmap="viridis")
    pmv.plot_inactive()
    pmv.plot_grid(lw=0.3)
    nhddf.plot(ax=axs[1])
    styles.heading(axs[1], "B.", heading="Structured Grid: non-uniform", x=0.08)

    # LGR grid
    pmvp = PlotMapView(modelgrid=sgrid, ax=axs[2])
    ptop = sgrid.top.copy()
    ptop[crow, ccol] = np.nan
    strms[crow, ccol] = np.nan
    pc = pmvp.plot_array(ptop, cmap="viridis", vmin=vmin, vmax=vmax)
    pmvp.plot_array(strms, masked_values=[0], alpha=0.3, cmap="Reds_r")
    pmvp.plot_inactive()
    pmvp.plot_grid(lw=0.3)
    nhddf.plot(ax=axs[2])

    pmvc = PlotMapView(modelgrid=childgrid, ax=axs[2])
    pmvc.plot_array(childtop, cmap="viridis", vmin=vmin, vmax=vmax)
    pmvc.plot_array(cstrms, masked_values=[0], alpha=0.3, cmap="Reds_r")
    pmvc.plot_grid(lw=0.3)
    styles.heading(axs[2], "C. ", heading="LGR Grid", x=0.08)

    # Quadtree grid
    pmv = PlotMapView(modelgrid=quadgrid, ax=axs[3])
    pc = pmv.plot_array(quadgrid.top)
    pmv.plot_array(qstrms, masked_values=[0,], alpha=0.3, cmap="Reds_r")
    pmv.plot_inactive()
    pmv.plot_grid(lw=0.2)
    nhddf.plot(ax=axs[3])
    styles.heading(axs[3], "D. ", heading="Quadtree Grid", x=0.08)

    # Triangular grid
    pmv = PlotMapView(modelgrid=trigrid, ax=axs[4])
    pc = pmv.plot_array(trigrid.top)
    pmv.plot_array(tristrms, masked_values=[0,], alpha=0.3, cmap="Reds_r")
    pmv.plot_inactive()
    pmv.plot_grid(lw=0.3)
    nhddf.plot(ax=axs[4])
    styles.heading(axs[4], "E. ", heading="Triangular Grid", x=0.08)

    # Voronoi grid
    pmv = PlotMapView(modelgrid=vorgrid, ax=axs[5])
    pc = pmv.plot_array(vorgrid.top)
    pmv.plot_array(vorstrms, masked_values=[0,], alpha=0.3, cmap="Reds_r")
    pmv.plot_inactive()
    pmv.plot_grid(lw=0.3)
    nhddf.plot(ax=axs[5])
    styles.heading(axs[5], "F. ", heading="Voronoi Grid", x=0.08)

    # colorbar


    # ax5.spines[["left", "right", "top", "bottom"]].set_visible(False)
    fig.colorbar(
        pc,
        ax=axm,
        location="top",
        label="Land surface elevation, in meters",
        shrink=0.5,
        fraction=.05
    )
---------------------------------------------------------------------------
NameError                                 Traceback (most recent call last)
Cell In[67], line 9
      5     fig, axm = plt.subplots(nrows=3, ncols=2, figsize=(10,12))
      6     axs = axm.ravel()
      7
      8     # structured grid
----> 9     pmv = PlotMapView(modelgrid=sgrid, ax=axs[0])
     10     pmv.plot_array(sgrid.top, cmap="viridis")
     11     pmv.plot_array(strms, masked_values=[0,], alpha=0.3, cmap="Reds_r")
     12     pmv.plot_inactive()

NameError: name 'PlotMapView' is not defined
More information
For more inforation and and examples on how to use the utilities presented in this notebook please see:
Examples
API reference
Activity (If time permits); Build a Voronoi mesh/Vertex Grid:
Define a voronoi grid for the basin upstream of the Black Earth Creek streamgauge near Cross Plains, WI. The upstream basin information is supplied by NLDI and has been saved to the class repo in case of internet connectivity or NLDI service issues.
Some of the previous code can be re-used to create a voronoi mesh and subsequent VertexGrid representation of the basin. See the Triangular and Voronoi grid sections of the notebook.
Optional, use the Upstream Main segment of Black Earth Creek to refine the voronoi mesh around the stream location. Refinement control points have been pre-defined below.
[68]:
epsg = 5070  # NAD83 CONUS Albers
# try:
    # todo: update this for black earth creek near cross plains WI site-no 05406479
be_cr_nr_cp = "05406479"
basindf = nldi.get_basin(
    feature_source="nwissite", feature_id=f"USGS-{be_cr_nr_cp}"
)
basindf = basindf.to_crs(epsg=epsg)
basindf.to_file(geospatial_ws / "black_earth_basin.shp")
# except (ValueError, ConnectionError, NameError):
#     basindf = gpd.read_file(geospatial_ws / "black_earth_basin.shp")
---------------------------------------------------------------------------
NameError                                 Traceback (most recent call last)
Cell In[68], line 5
      1 epsg = 5070  # NAD83 CONUS Albers
      2 # try:
      3     # todo: update this for black earth creek near cross plains WI site-no 05406479
      4 be_cr_nr_cp = "05406479"
----> 5 basindf = nldi.get_basin(
      6     feature_source="nwissite", feature_id=f"USGS-{be_cr_nr_cp}"
      7 )
      8 basindf = basindf.to_crs(epsg=epsg)

NameError: name 'nldi' is not defined
[69]:
try:
    nhddf = nldi.get_flowlines(
        navigation_mode="UM",
        distance=9999,
        feature_source="nwissite",
        feature_id=f"USGS-{be_cr_nr_cp}",
    )
    nhddf = nhddf.to_crs(epsg=epsg)
    nhddf.to_file(geospatial_ws / "black_earth_creek_main.shp")
except (ValueError, ConnectionError, NameError):
    nhddf = gpd.read_file(geospatial_ws / "black_earth_creek_main.shp")
Visualize the example “study area”
[70]:
fig, ax = plt.subplots()

basindf.plot(ax=ax, facecolor="None", edgecolor="k")
nhddf.plot(ax=ax)
ctx.add_basemap(
    ax=ax,
    crs=basindf.crs,
    source=ctx.providers.USGS.USTopo
)
---------------------------------------------------------------------------
NameError                                 Traceback (most recent call last)
Cell In[70], line 3
      1 fig, ax = plt.subplots()
      2
----> 3 basindf.plot(ax=ax, facecolor="None", edgecolor="k")
      4 nhddf.plot(ax=ax)
      5 ctx.add_basemap(
      6     ax=ax,

NameError: name 'basindf' is not defined

Grid refinement control points are defined here for the optional part of this exercise
[71]:
wsloc = basindf.centroid.values[0]
stloc = list(zip(*nhddf.geometry.values[10].xy))[0]
---------------------------------------------------------------------------
NameError                                 Traceback (most recent call last)
Cell In[71], line 1
----> 1 wsloc = basindf.centroid.values[0]
      2 stloc = list(zip(*nhddf.geometry.values[10].xy))[0]

NameError: name 'basindf' is not defined
[ ]:
[ ]:
[ ]: